Code Coverage
What you'll learn
- How to instrument your application code
- How to save the coverage information collected during end-to-end and unit tests
- How to use the code coverage reports to guide writing tests
Introduction
As you write more and more end-to-end tests, you will find yourself wondering - do I need to write more tests? Are there parts of the application still untested? Are there parts of the application that perhaps are tested too much? One answer to those questions is to find out which lines of the application's source code were executed during end-to-end tests. If there are important sections of the application's logic that were not executed from the tests, then a new test should be added to ensure that part of our application logic is tested.
Computing the source code lines that were executed during the test is done through code coverage. Code coverage requires inserting additional counters into your source code before running it. This step is called instrumentation. Instrumentation takes code that looks like this...
// add.js
function add(a, b) {
  return a + b
}
module.exports = { add }
...and parses it to find all functions, statements, and branches and then inserts counters into the code. For the above code it might look like this:
// this object counts the number of times each
// function and each statement is executed
const c = (window.__coverage__ = {
  // "f" counts the number of times each function is called
  // we only have a single function in the source code
  // thus it starts with [0]
  f: [0],
  // "s" counts the number of times each statement is called
  // we have 3 statements and they all start with 0
  s: [0, 0, 0],
})

// the original code + increment statements
// uses "c" alias to "window.__coverage__" object
// the first statement defines the function,
// let's increment it
c.s[0]++
function add(a, b) {
  // function is called and then the 2nd statement
  c.f[0]++
  c.s[1]++

  return a + b
}
// 3rd statement is about to be called
c.s[2]++
module.exports = { add }
Imagine we load the above instrumented source file from our test spec file. Immediately some counters will be incremented!
// add.cy.js
const { add } = require('./add')
// JavaScript engine has parsed and evaluated "add.js" source code
// which ran some of the increment statements
// __coverage__ has now
// f: [0] - function "add" was NOT executed
// s: [1, 0, 1] - first and third counters were incremented
// but the statement inside function "add" was NOT executed
We want to make sure every statement and function in the file add.js has been
executed by our tests at least once. Thus we write a test:
// add.cy.js
const { add } = require('./add')

it('adds numbers', () => {
  expect(add(2, 3)).to.equal(5)
})
When the test calls add(2, 3), the counter increments inside the "add"
function are executed, and the coverage object becomes:
{
  // "f" keeps count of times each function was called
  // we only have a single function in the source code
  // thus it starts with [0]
  f: [1],
  // "s" keeps count of times each statement was called
  // we have 3 statements, and they all start with 0
  s: [1, 1, 1]
}
This single test has achieved 100% code coverage - every function and every statement has been executed at least once. But, in real world applications, achieving 100% code coverage requires multiple tests.
Once the tests finish, the coverage object can be serialized and saved to disk so that a human-friendly report can be generated. The collected coverage information can also be sent to external services and help during pull request reviews.
This guide explains how to instrument the application source code using common
tools. Then we show how to save the coverage information and generate reports
using the
@cypress/code-coverage Cypress
plugin. After reading this guide you should be able to better target your tests
using the code coverage information.
This guide explains how to find what parts of your application code are covered by Cypress tests so you can have 100% confidence that your tests aren't missing crucial parts of your application. The collected information can be sent to external services, automatically run during pull request reviews, and integrated into CI.
The full source code for this guide can be found in the cypress-io/cypress-example-todomvc-redux repository.
Instrumenting code
Cypress does not instrument your code - you need to do it yourself. The golden standard for JavaScript code instrumentation is the battle-hardened Istanbul and, luckily, it plays very nicely with the Cypress. You can instrument the code as a build step through one of two ways:
- Using the nyc module - a command-line interface for the Istanbul library
- As part of your code transpilation pipeline using the
babel-plugin-istanbultool.
Using NYC
To instrument the application code located in your src folder and save it in
an instrumented folder use the following command:
npx nyc instrument --compact=false src instrumented
We are passing the --compact=false flag to generate human-friendly output.
The instrumentation takes your original code like this fragment...
const store = createStore(reducer)

render(
  <Provider store={store}>
    <App />
  </Provider>,
  document.getElementById('root')
)
...and wraps each statement with additional counters that keep track of how many times each source line has been executed by the JavaScript runtime.
const store = (cov_18hmhptych.s[0]++, createStore(reducer))
cov_18hmhptych.s[1]++
render(
  <Provider store={store}>
    <App />
  </Provider>,
  document.getElementById('root')
)
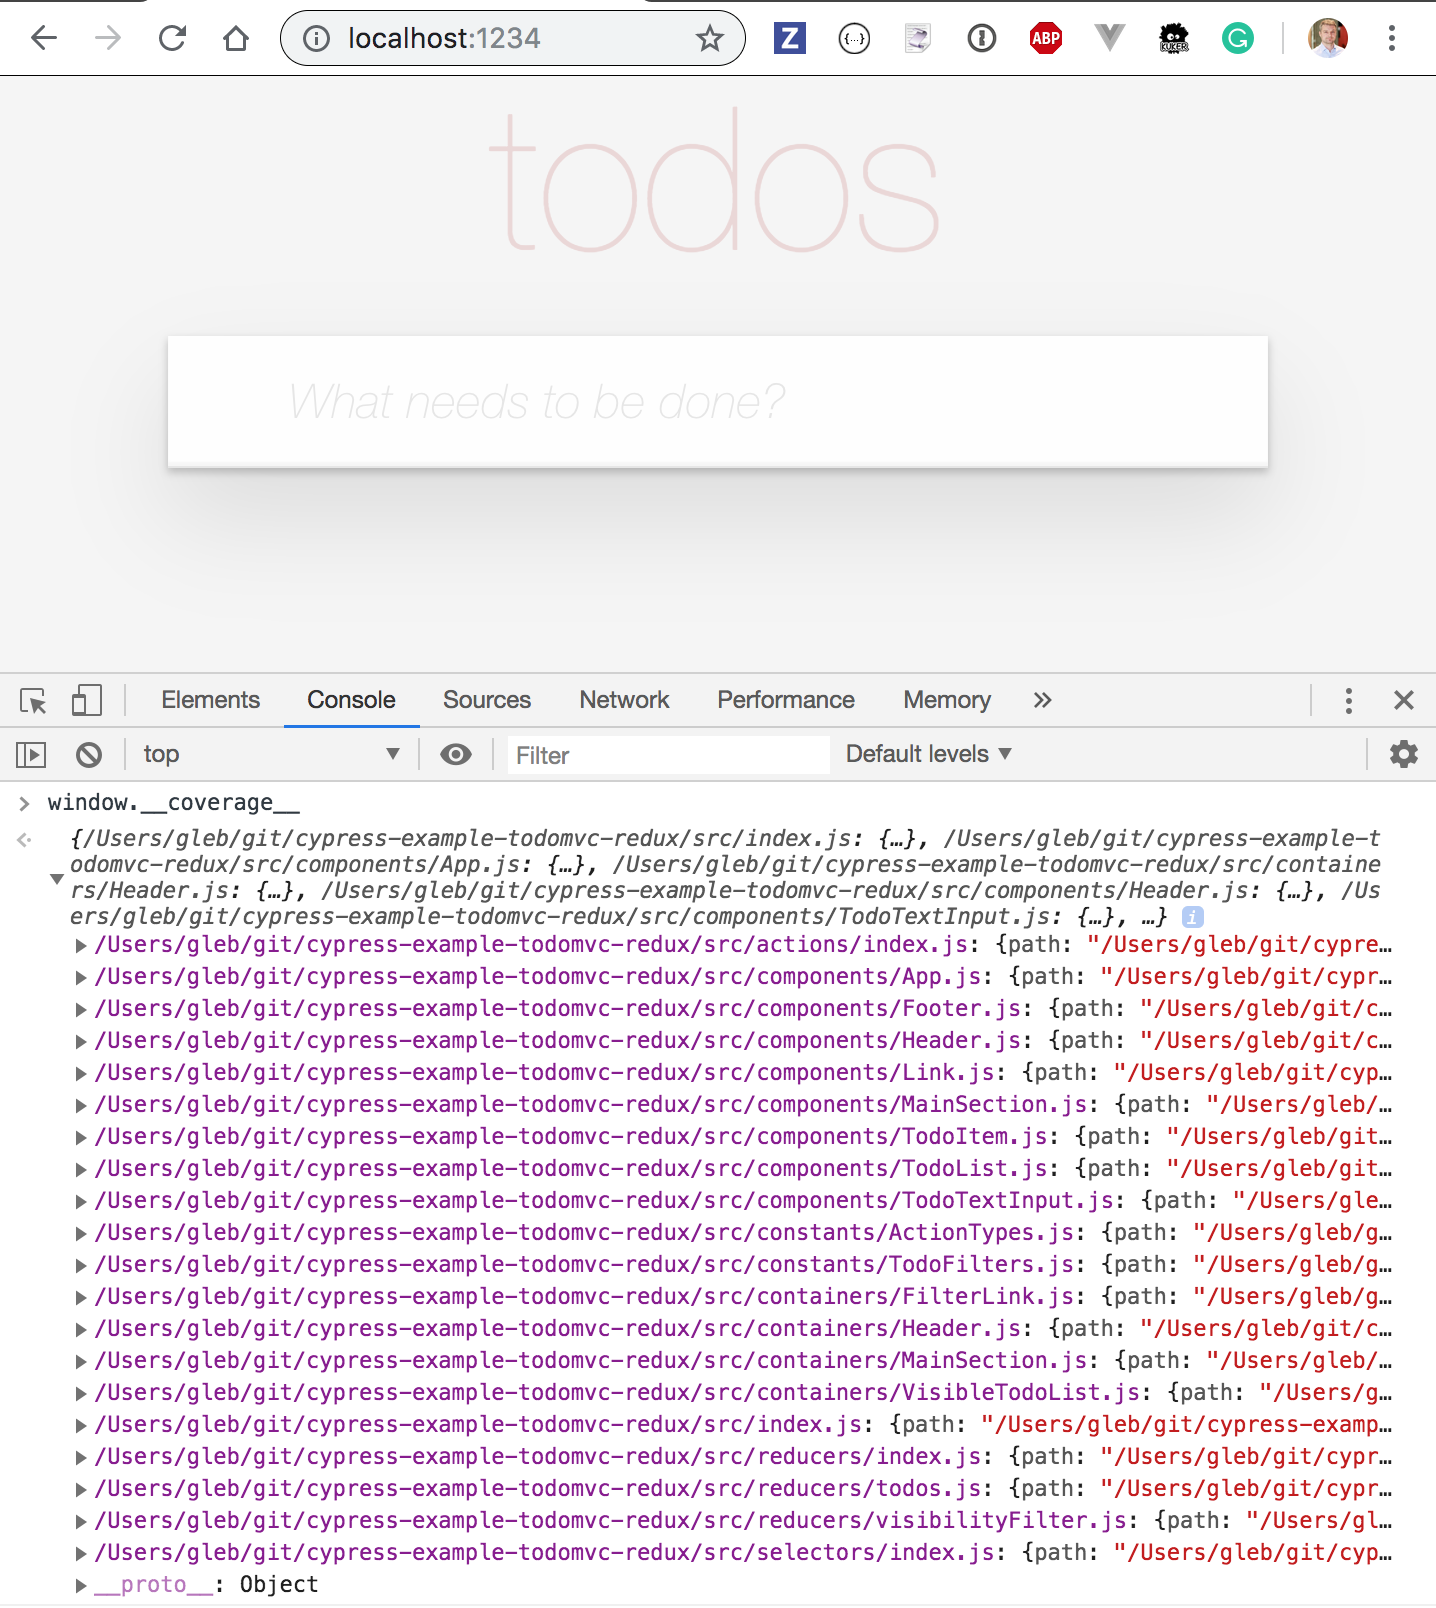
Notice the calls to cov_18hmhptych.s[0]++ and cov_18hmhptych.s[1]++ that
increment the statement counters. All counters and additional book-keeping
information is stored in a single object attached to the browser's window
object. We can see the counters if we serve the instrumented folder instead of
src and open the application.
If we drill into the coverage object we can see the statements executed in each
file. For example the file src/index.js has the following information:
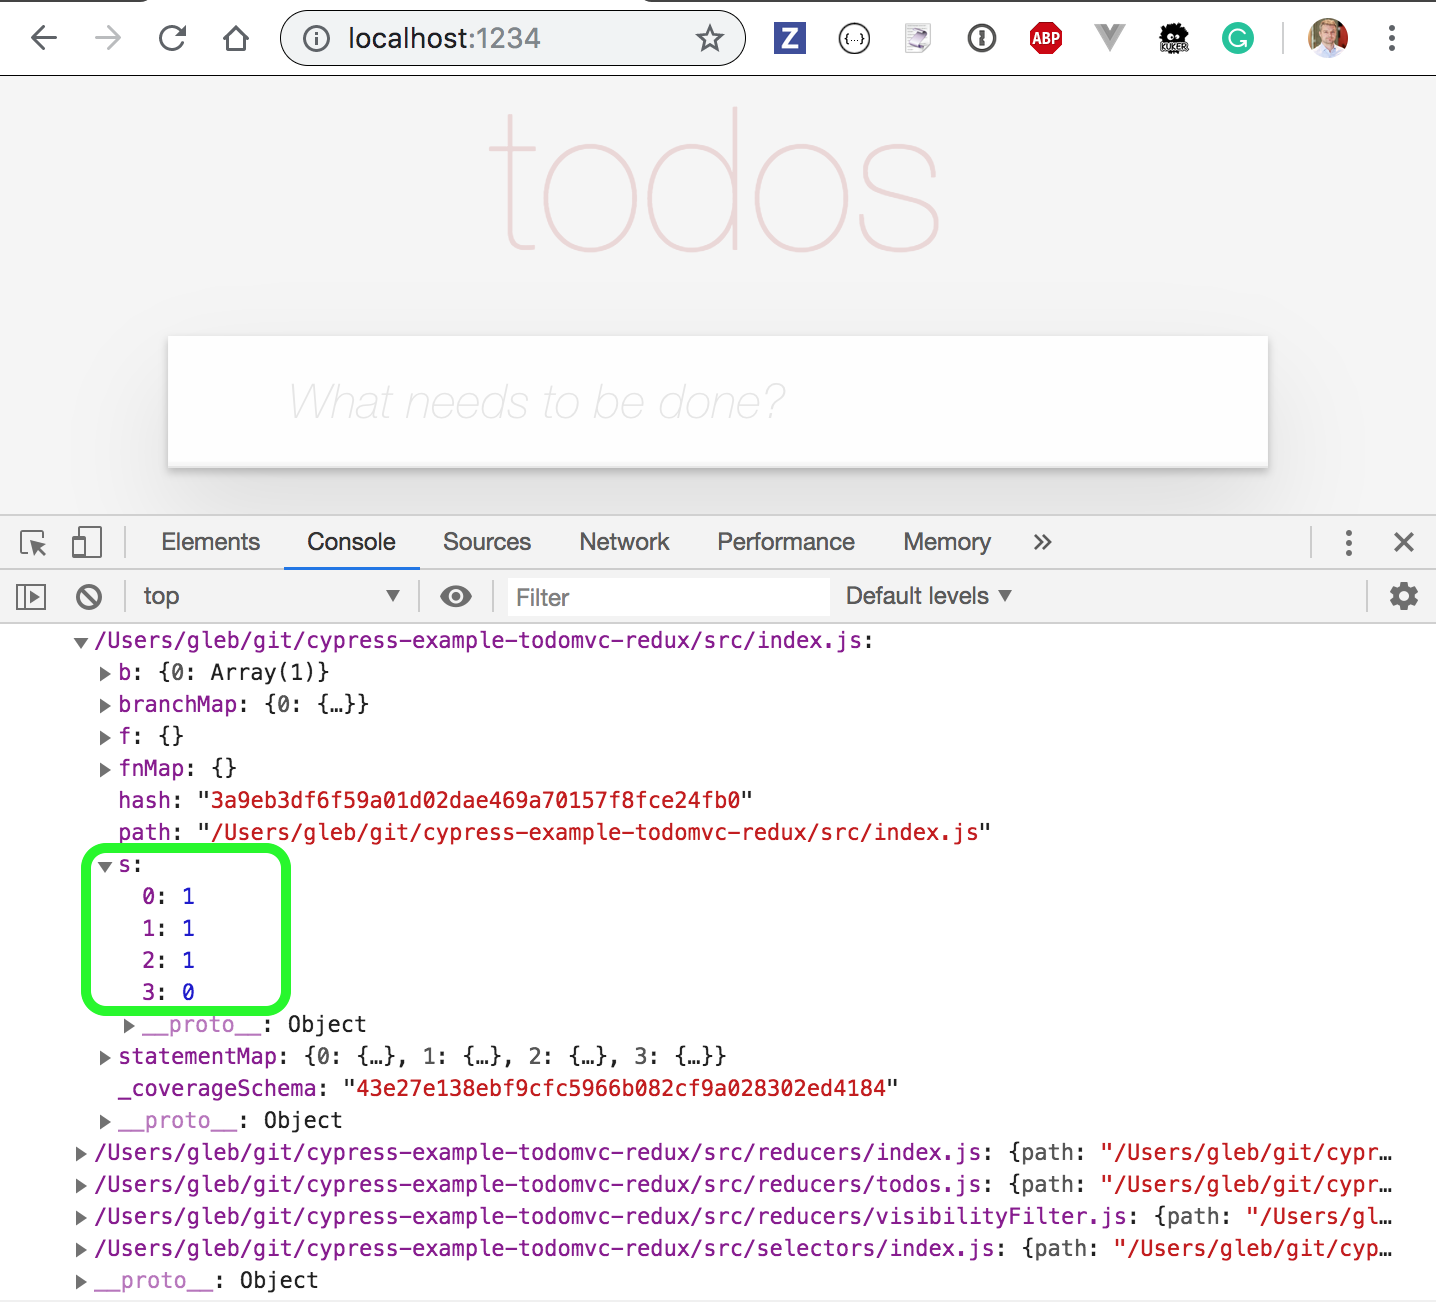
In green, we highlighted the 4 statements present in that file. The first three
statements were each executed once and the last statement was never executed (it
probably was inside an if statement). By using the application, we can both
increment the counters and flip some of the zero counters into positive numbers.
Using code transpilation pipeline
Instead of using the npx instrument command, we can use
babel-plugin-istanbul
to instrument the code as part of its transpilation. Add this plugin to the
.babelrc file.
{
  "presets": ["@babel/preset-react"],
  "plugins": ["transform-class-properties", "istanbul"]
}
We can now serve the application and get instrumented code without an
intermediate folder, but the result is the same instrumented code loaded by the
browser, with the same window.__coverage__ object keeping track of the
original statements.
Check out
@cypress/code-coverage#examples
for full example projects showing different code coverage setups.
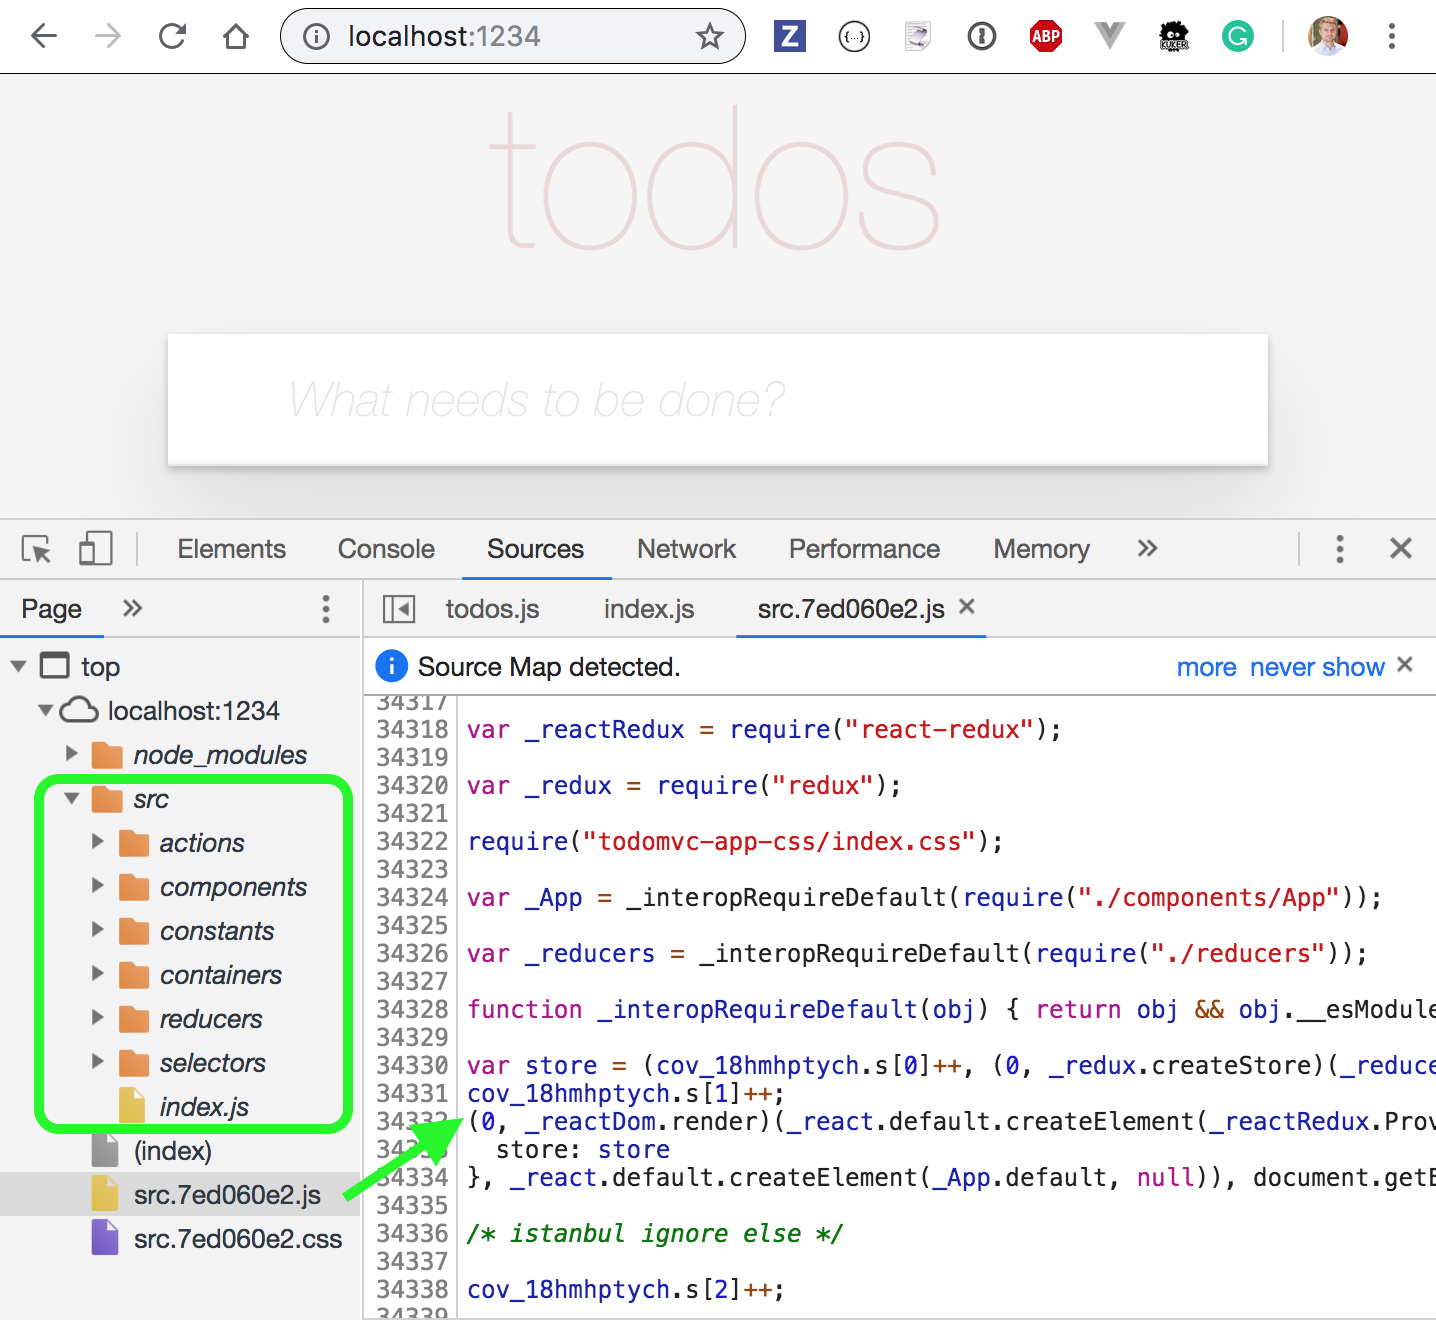
A really nice feature of both nyc and
babel-plugin-istanbul
is that the source maps are generated automatically, allowing us to collect code
coverage information, but also interact with the original, non-instrumented code
in the Developer Tools. In the screenshot above the bundle (green arrow) has
coverage counters, but the source mapped files in the green rectangle show the
original code.
The nyc and babel-plugin-istanbul only instrument the application code and
not 3rd party dependencies from node_modules.
E2E code coverage
To handle code coverage collected during each test, we created a
@cypress/code-coverage Cypress
plugin. It merges coverage from each test and saves the combined result. It also
calls nyc (its peer dependency) to generate static HTML reports for human
consumption.
Install the plugin
Please consult the
@cypress/code-coverage
documentation for up-to-date installation instructions.
npm install @cypress/code-coverage --save-dev
Then add the code below to the supportFile and setupNodeEvents function.
// cypress/support/e2e.js
import '@cypress/code-coverage/support'
- cypress.config.js
- cypress.config.ts
const { defineConfig } = require('cypress')

module.exports = defineConfig({
  // setupNodeEvents can be defined in either
  // the e2e or component configuration
  e2e: {
    setupNodeEvents(on, config) {
      require('@cypress/code-coverage/task')(on, config)
      // include any other plugin code...

      // It's IMPORTANT to return the config object
      // with any changed environment variables
      return config
    },
  },
})
import { defineConfig } from 'cypress'

export default defineConfig({
  // setupNodeEvents can be defined in either
  // the e2e or component configuration
  e2e: {
    setupNodeEvents(on, config) {
      require('@cypress/code-coverage/task')(on, config)
      // include any other plugin code...

      // It's IMPORTANT to return the config object
      // with any changed environment variables
      return config
    },
  },
})
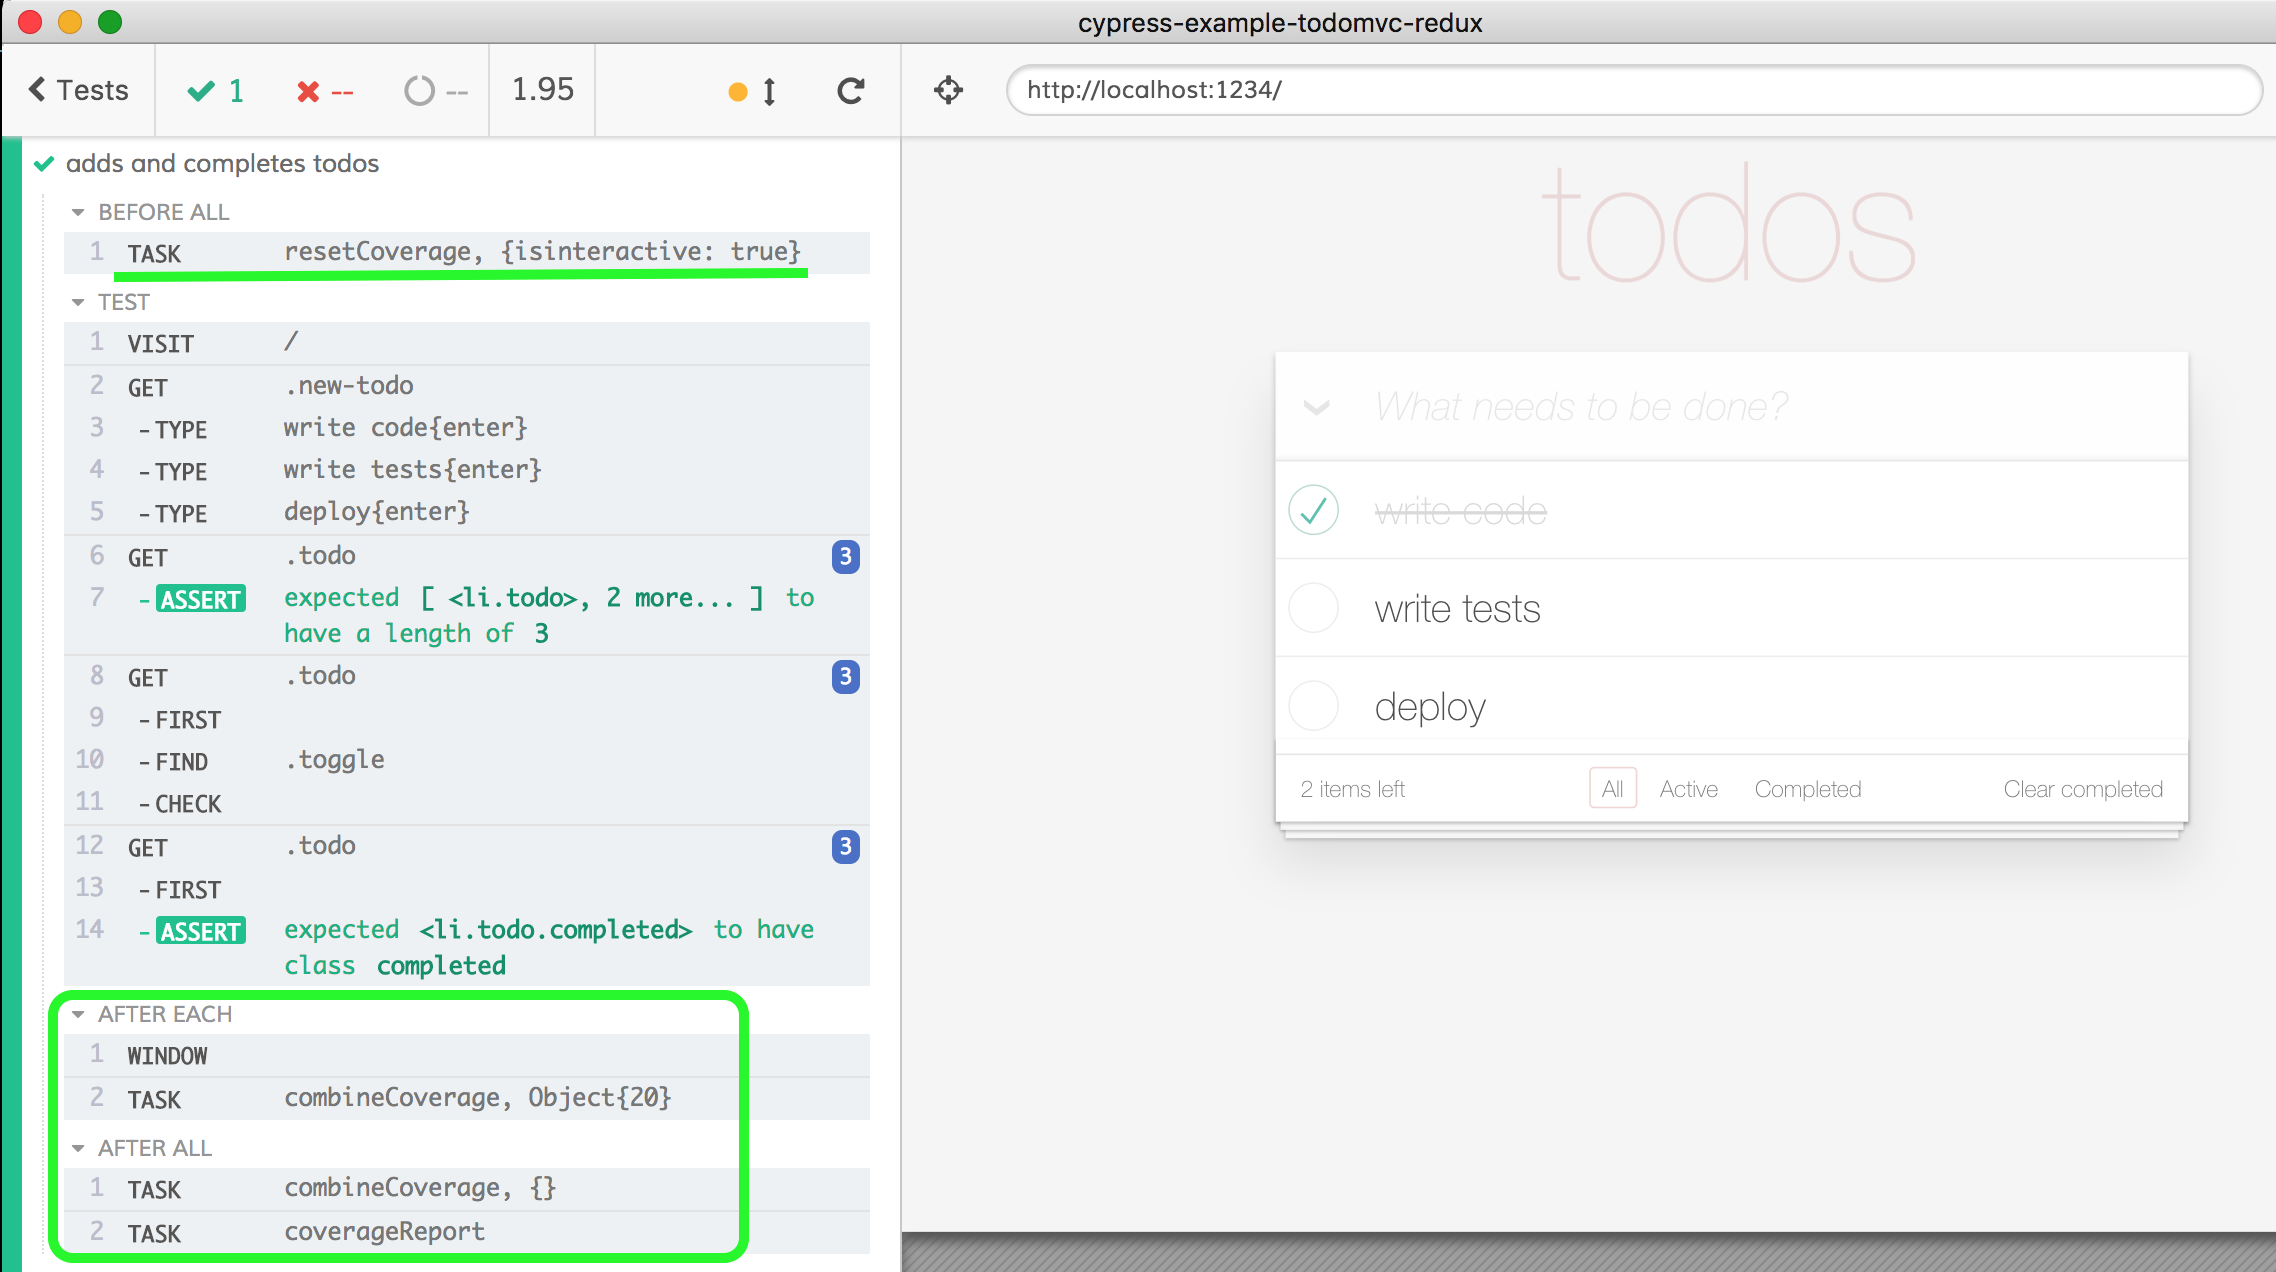
When you run the Cypress tests now, you should see a few commands after the tests finish. We have highlighted these commands using a green rectangle below.
After the tests complete, the final code coverage is saved to a .nyc_output
folder. It is a JSON file from which we can generate a report in a variety of
formats. The
@cypress/code-coverage plugin
generates the HTML report automatically - you can open the coverage/index.html
page locally after the tests finish. You can also call nyc report to generate
other reports, for example, sending the coverage information to 3rd party
services.
See code coverage summary
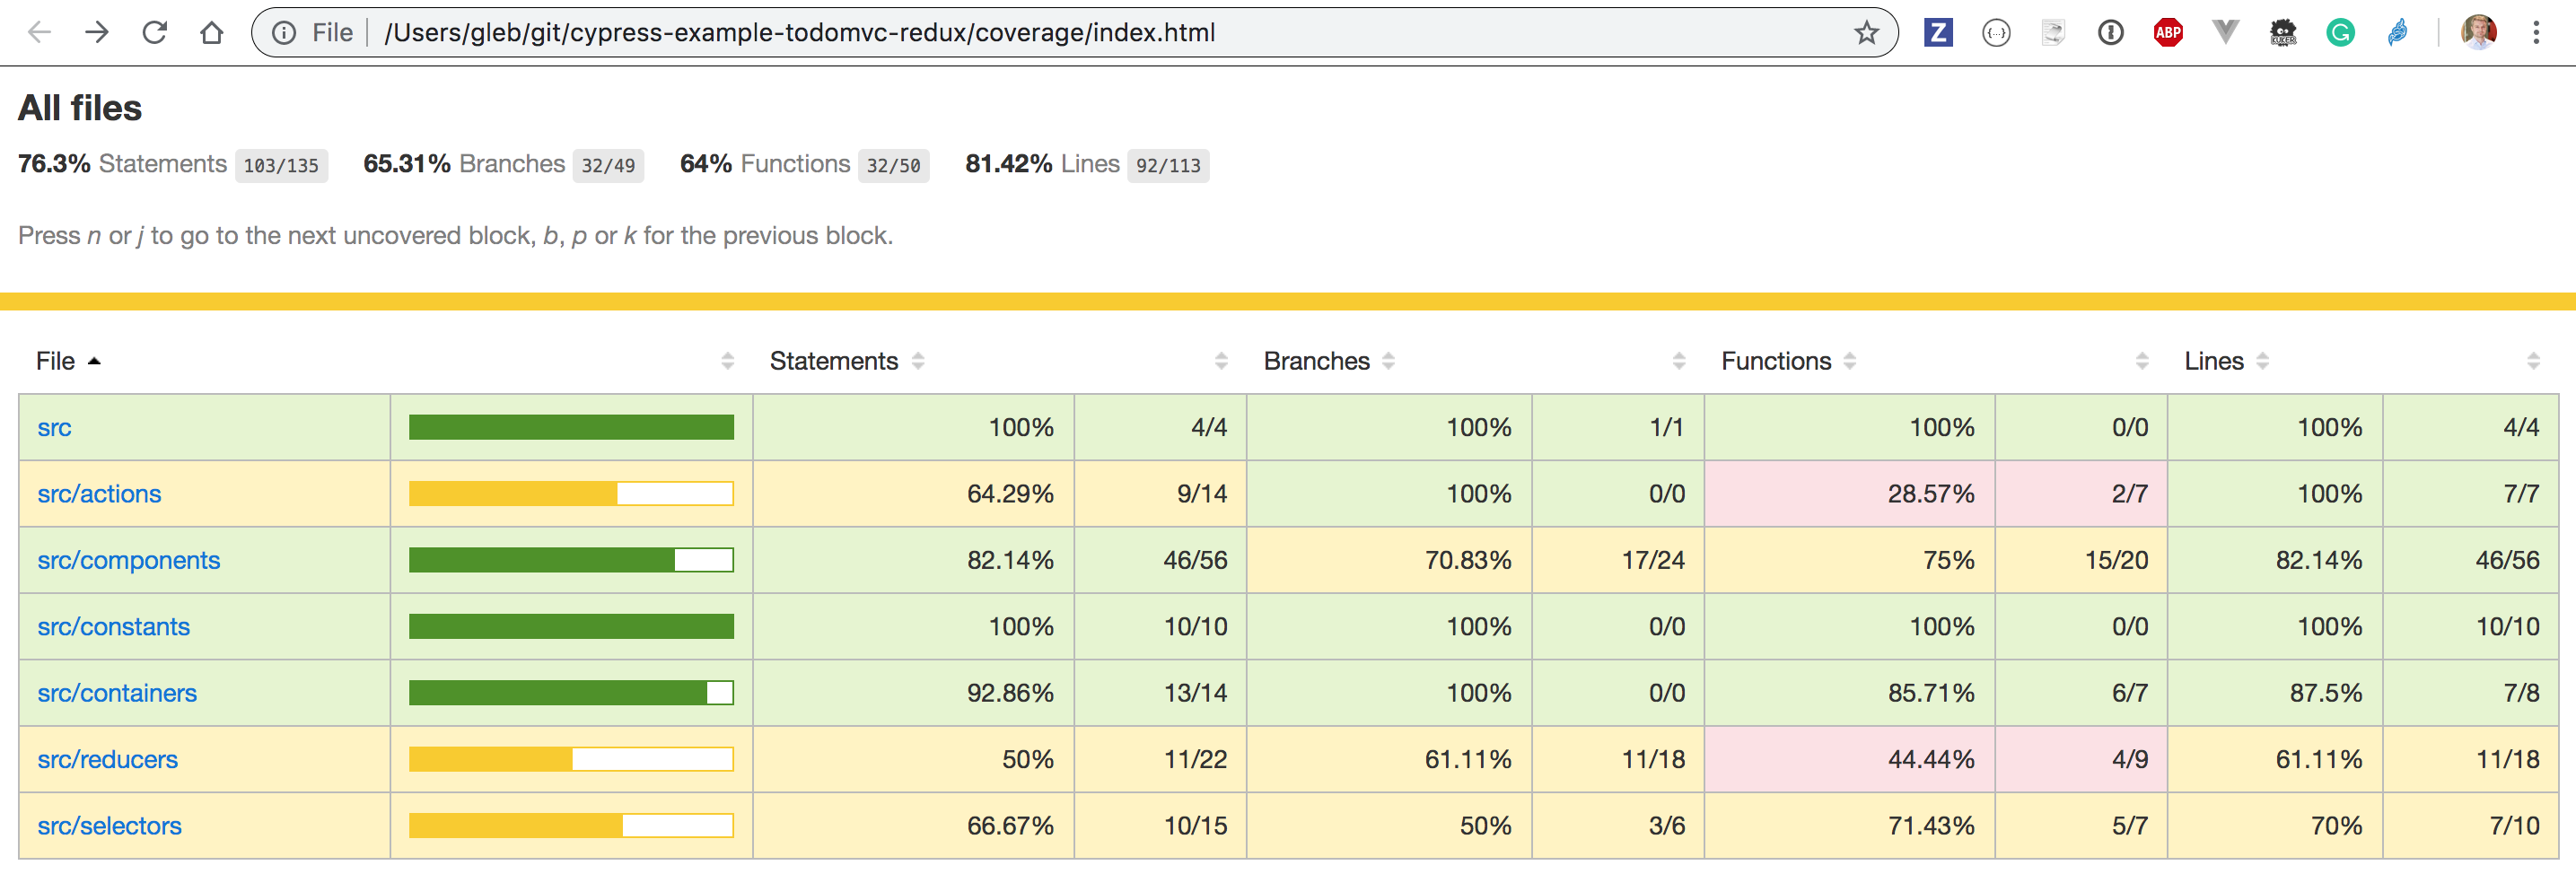
To see the summary of the code coverage after tests run, run the command below.
npx nyc report --reporter=text-summary

========= Coverage summary =======
Statements   : 76.3% ( 103/135 )
Branches     : 65.31% ( 32/49 )
Functions    : 64% ( 32/50 )
Lines        : 81.42% ( 92/113 )
==================================
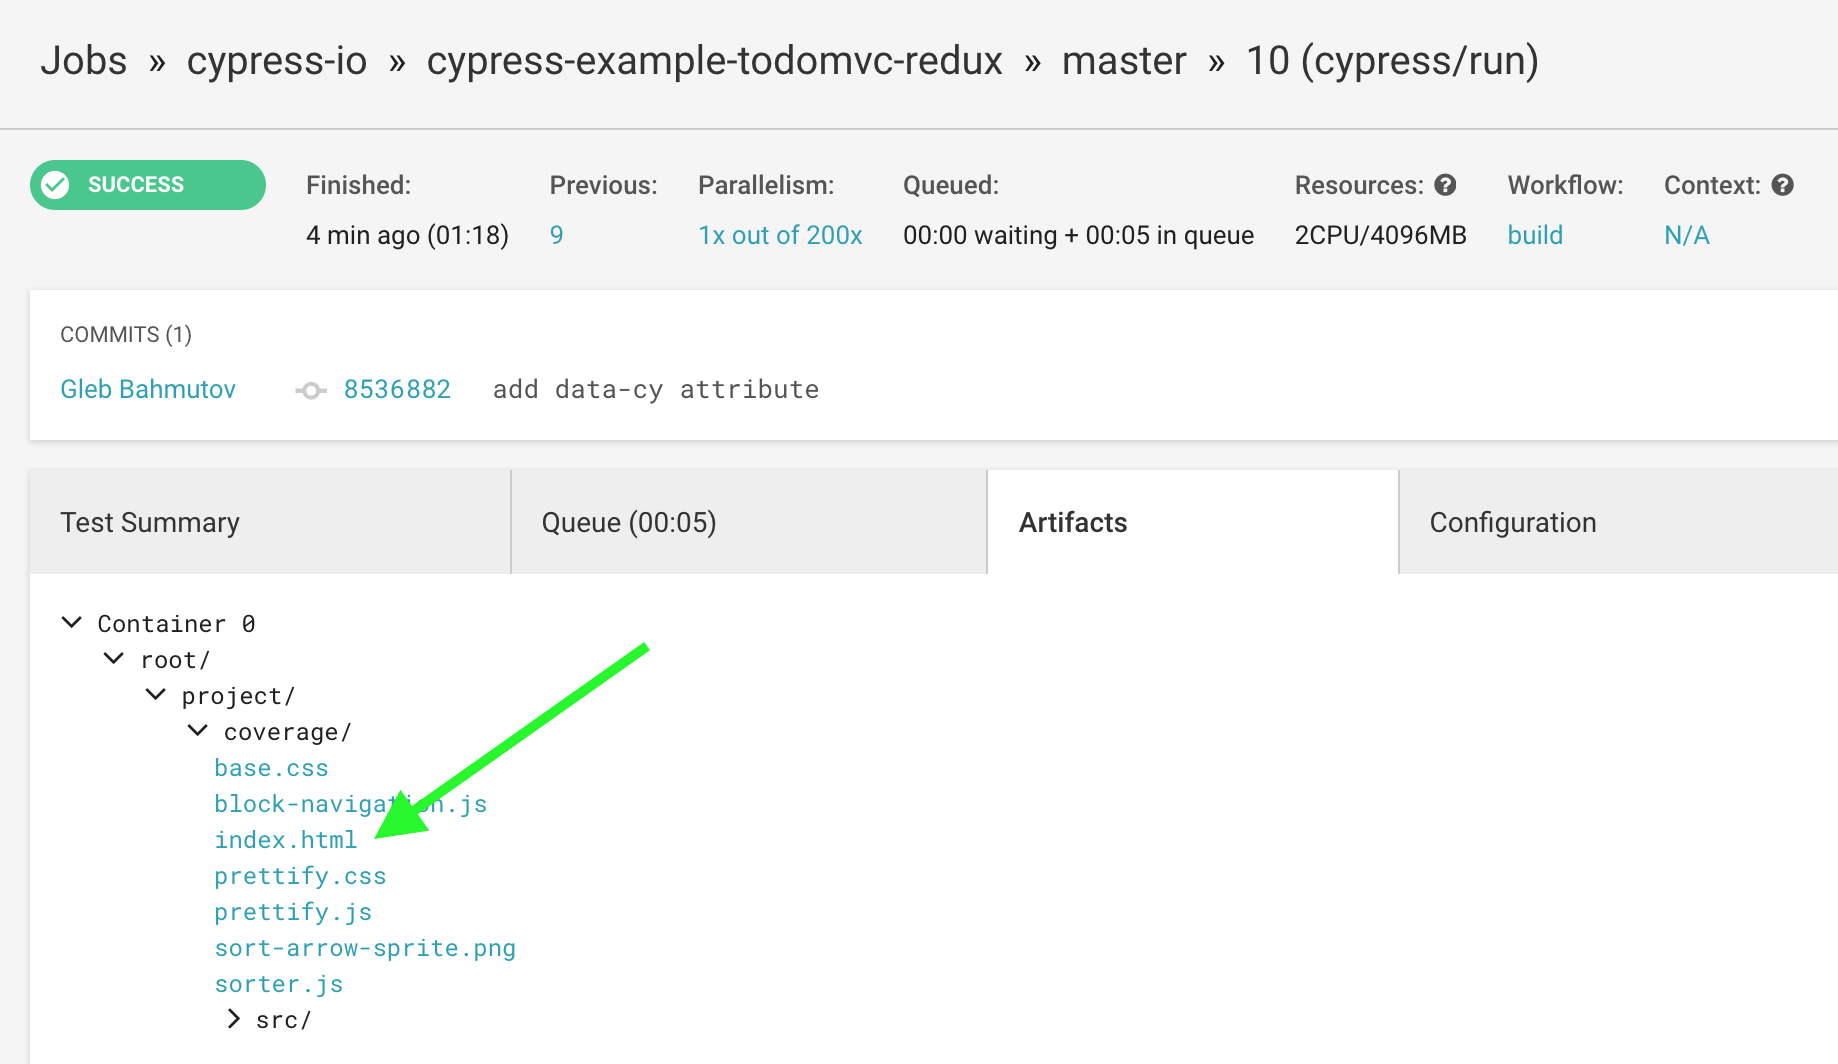
Tip: store the coverage folder as a build artifact on your continuous
integration server. Because the report is a static HTML page, some CIs can show
it right from their web applications. The screenshot below shows the coverage
report stored on CircleCI. Clicking on index.html shows the report right in
the browser.
Code coverage as a guide
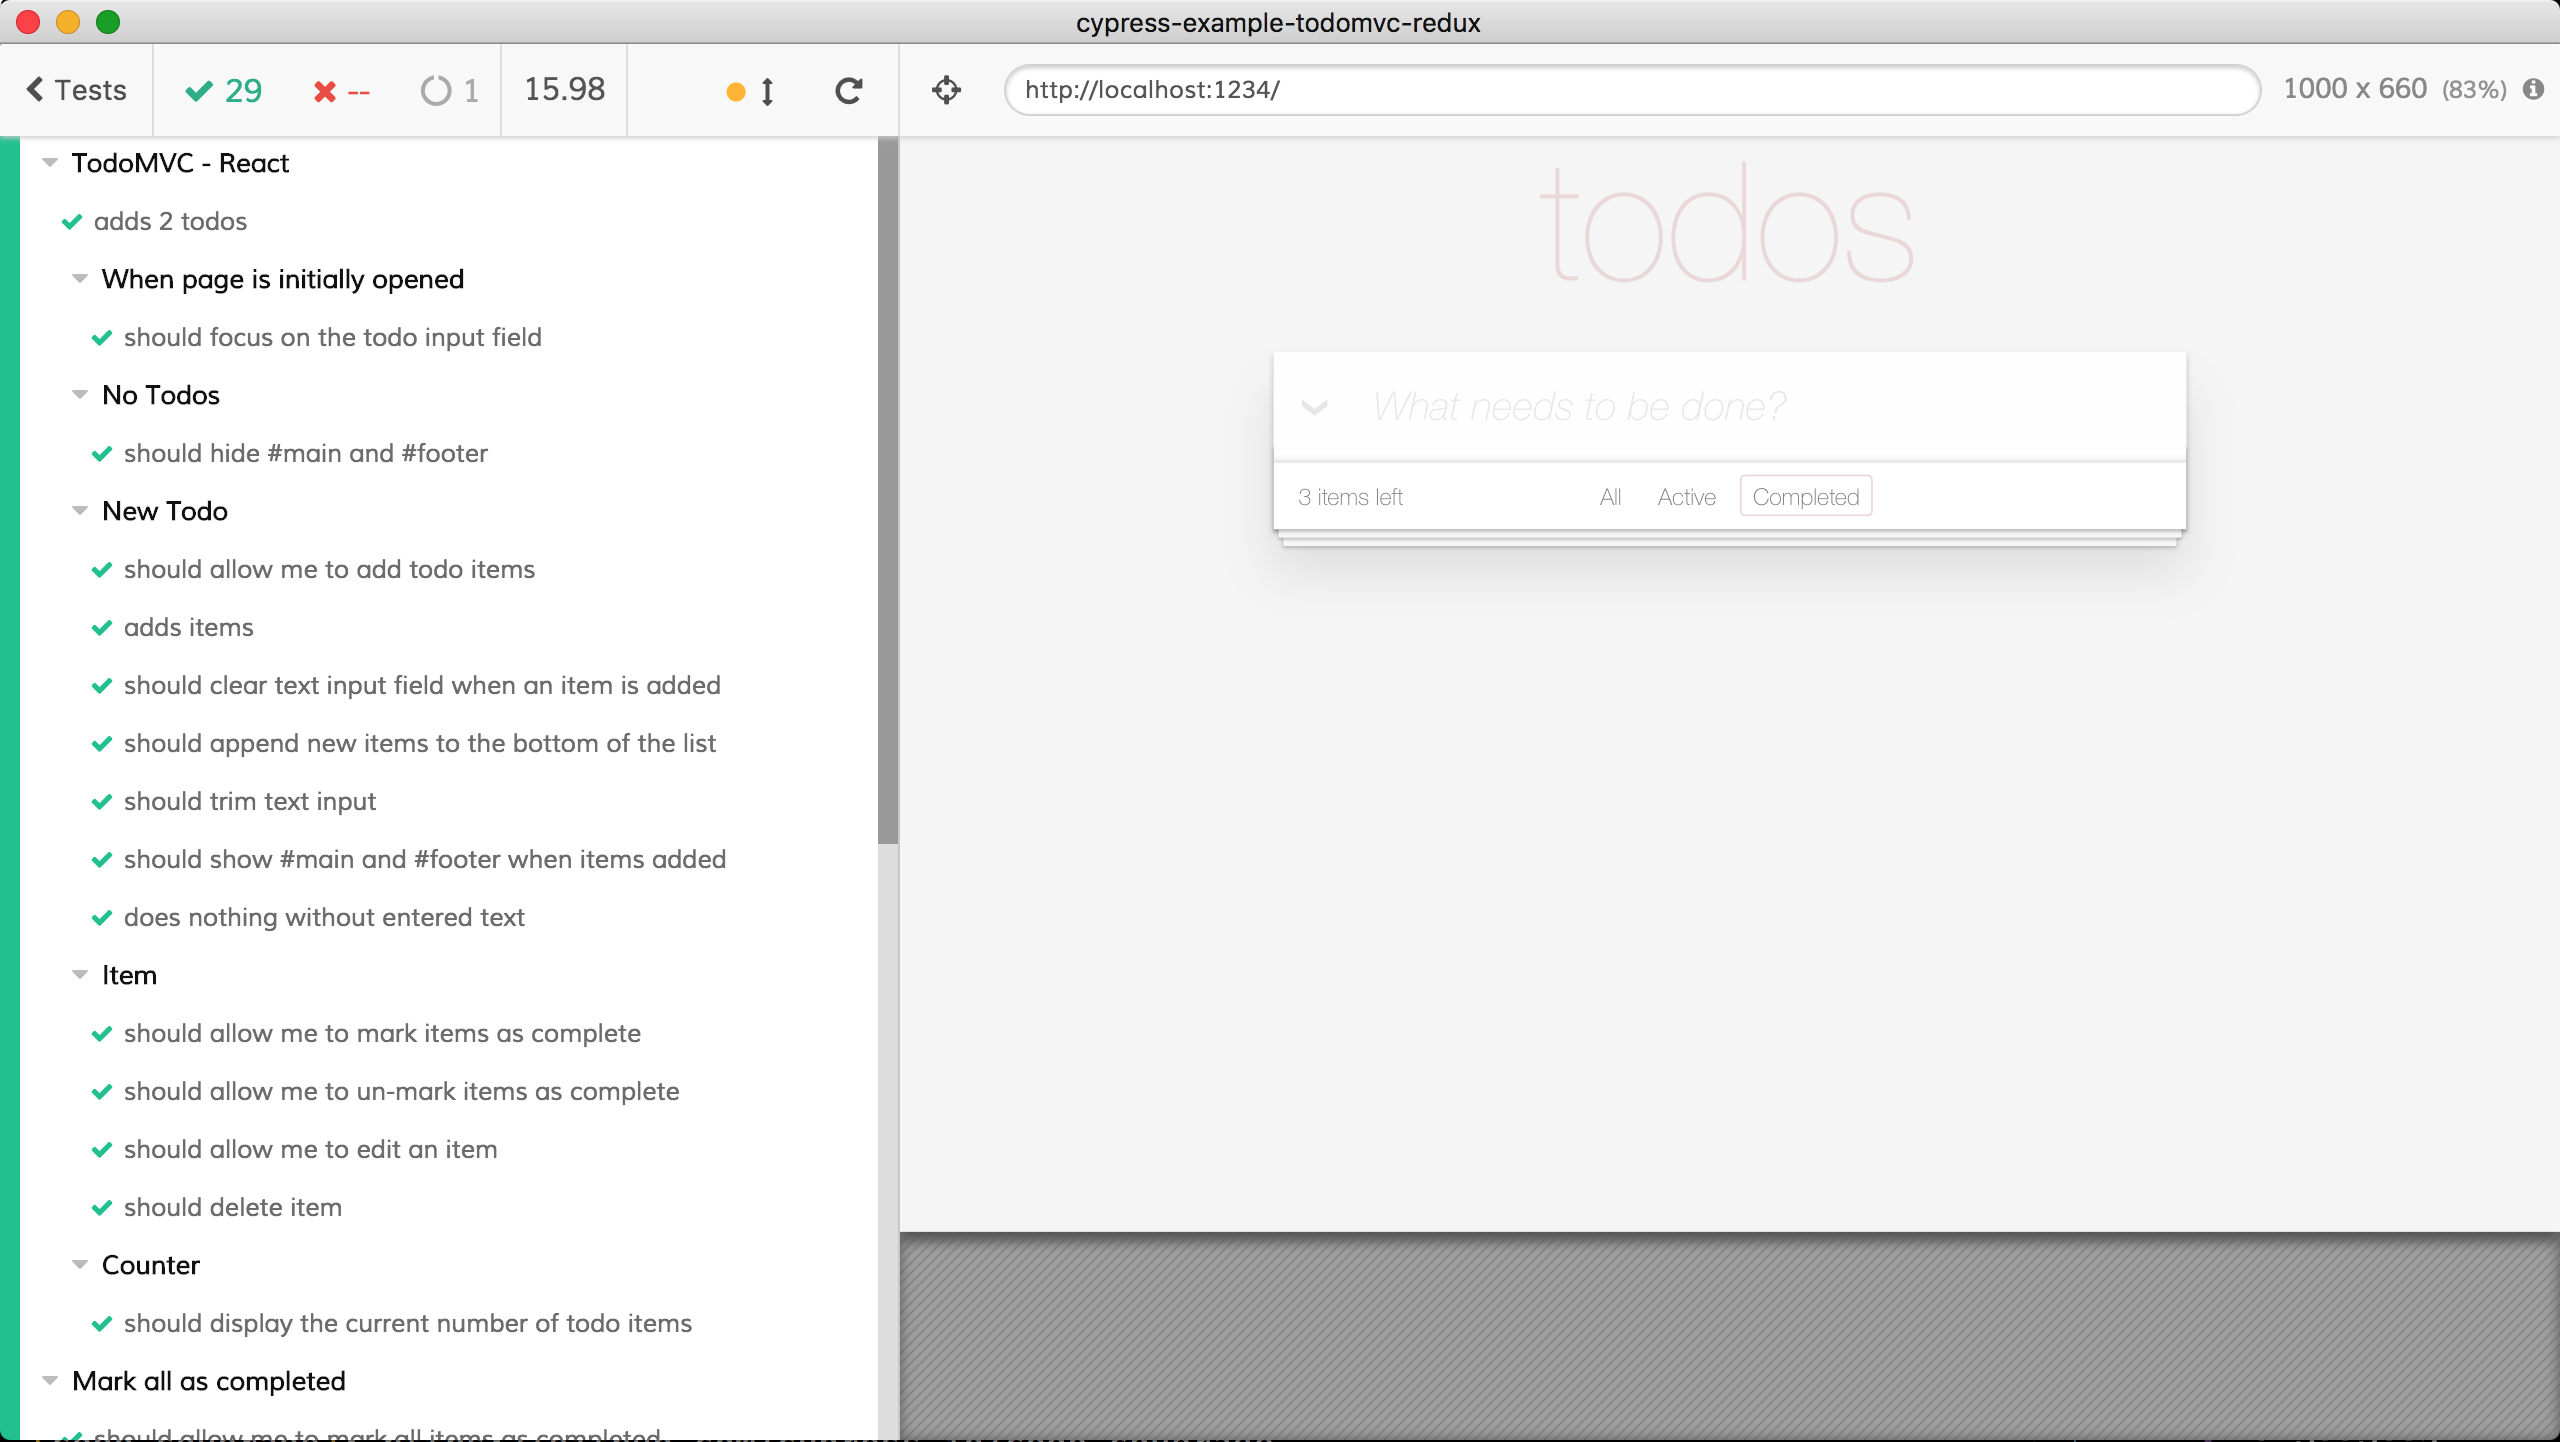
Even a single test can cover a lot of the application code. For example, let's run the following test that adds a few items, then marks one of them as completed.
- End-to-End Test
- Component Test
it('adds and completes todos', () => {
  cy.visit('/')
  cy.get('.new-todo')
    .type('write code{enter}')
    .type('write tests{enter}')
    .type('deploy{enter}')

  cy.get('.todo').should('have.length', 3)

  cy.get('.todo').first().find('.toggle').check()

  cy.get('.todo').first().should('have.class', 'completed')
})
it('adds and completes todos', () => {
  cy.mount(<AddTodo />)
  cy.get('.new-todo')
    .type('write code{enter}')
    .type('write tests{enter}')
    .type('deploy{enter}')

  cy.get('.todo').should('have.length', 3)

  cy.get('.todo').first().find('.toggle').check()

  cy.get('.todo').first().should('have.class', 'completed')
})
After running the test and opening the HTML report, we see 76% code coverage in our application.
Even better, we can drill down into the individual source files to see what code
we missed. In our example application, the main state logic is in the
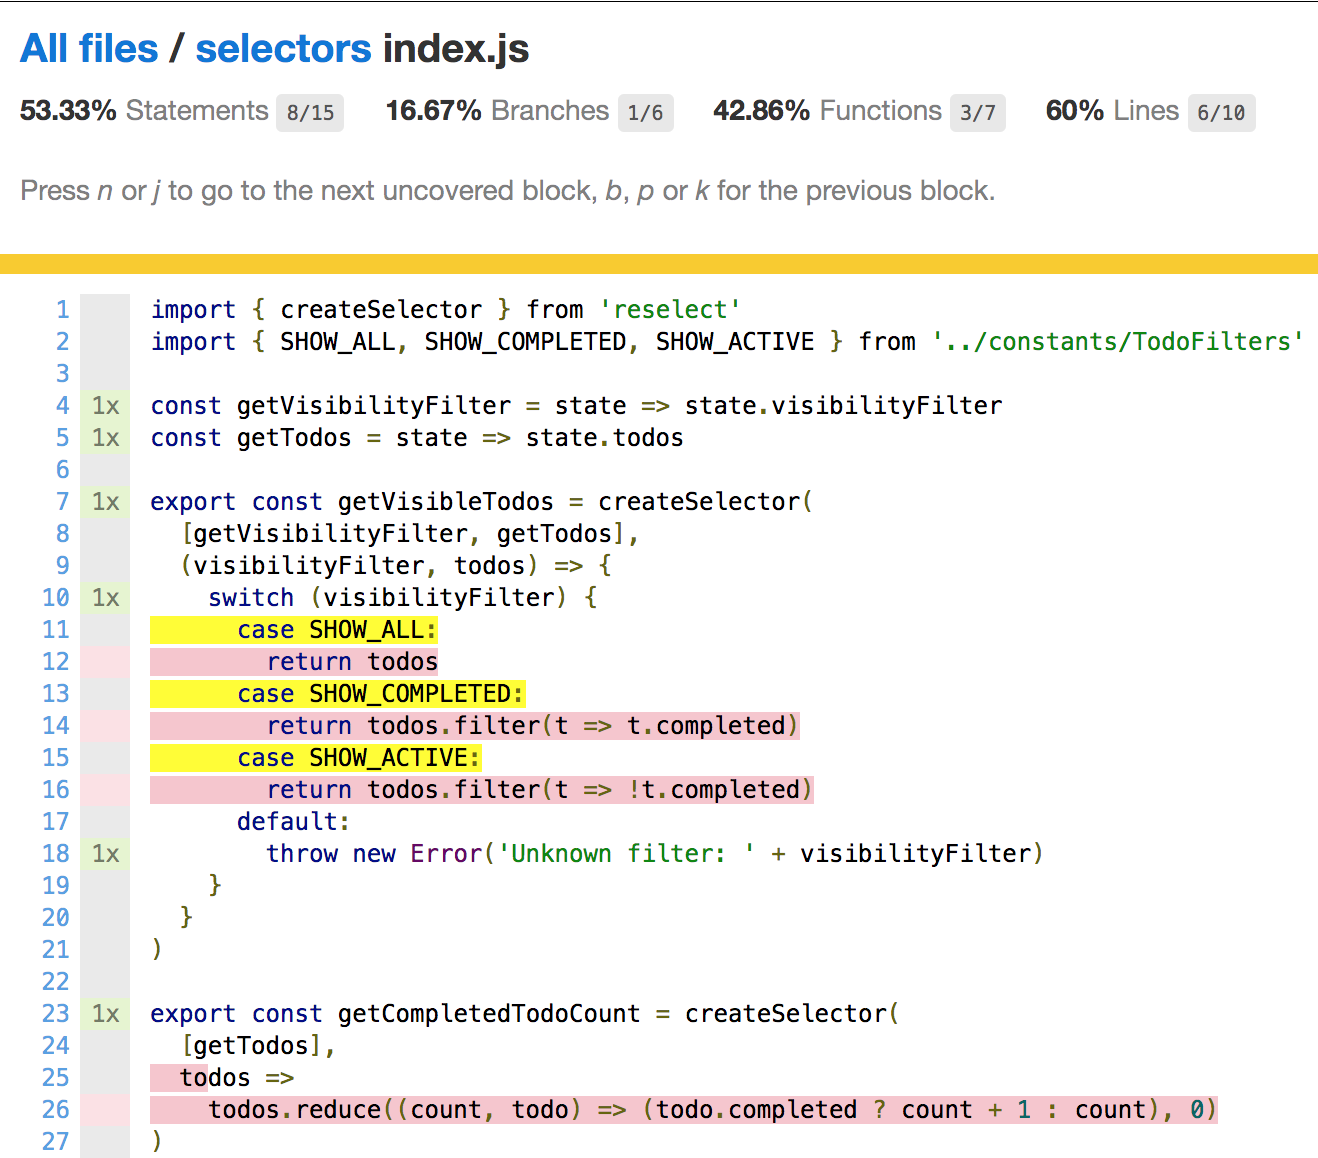
src/reducers/todos.js file. Let's see the code coverage in this file:
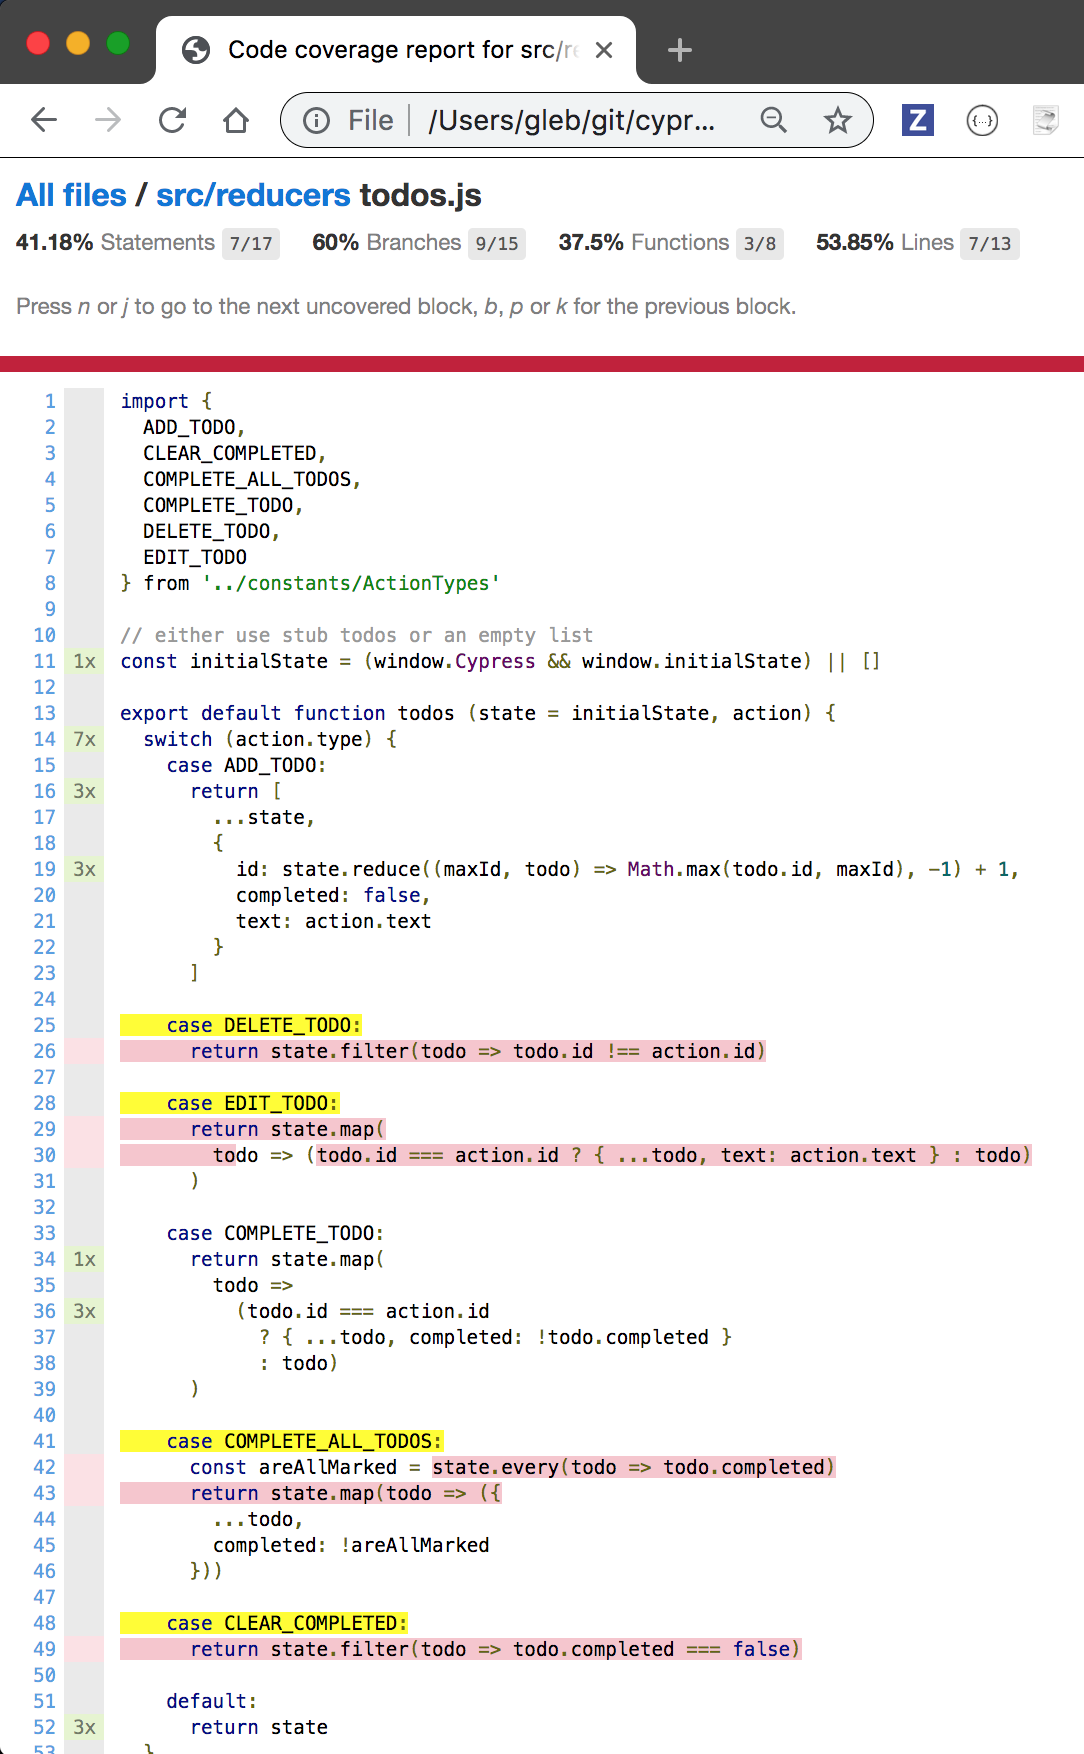
Notice how the ADD_TODO action was executed 3 times - because our test has added 3 todo items, and the COMPLETE_TODO action was executed just once - because our test has marked 1 todo item as completed.
The source lines not covered marked in yellow (the switch cases the test missed)
and red (regular statements) are a great guide for writing more end-to-end
tests. We need tests that delete todo items, edit them, mark all of them as
completed at once and clear completed items. When we cover every switch
statement in src/reducers/todos.js we probably will achieve close to 100% code
coverage. Even more importantly, we will cover the main features of the
application the user is expected to use.
We can write more E2E tests.
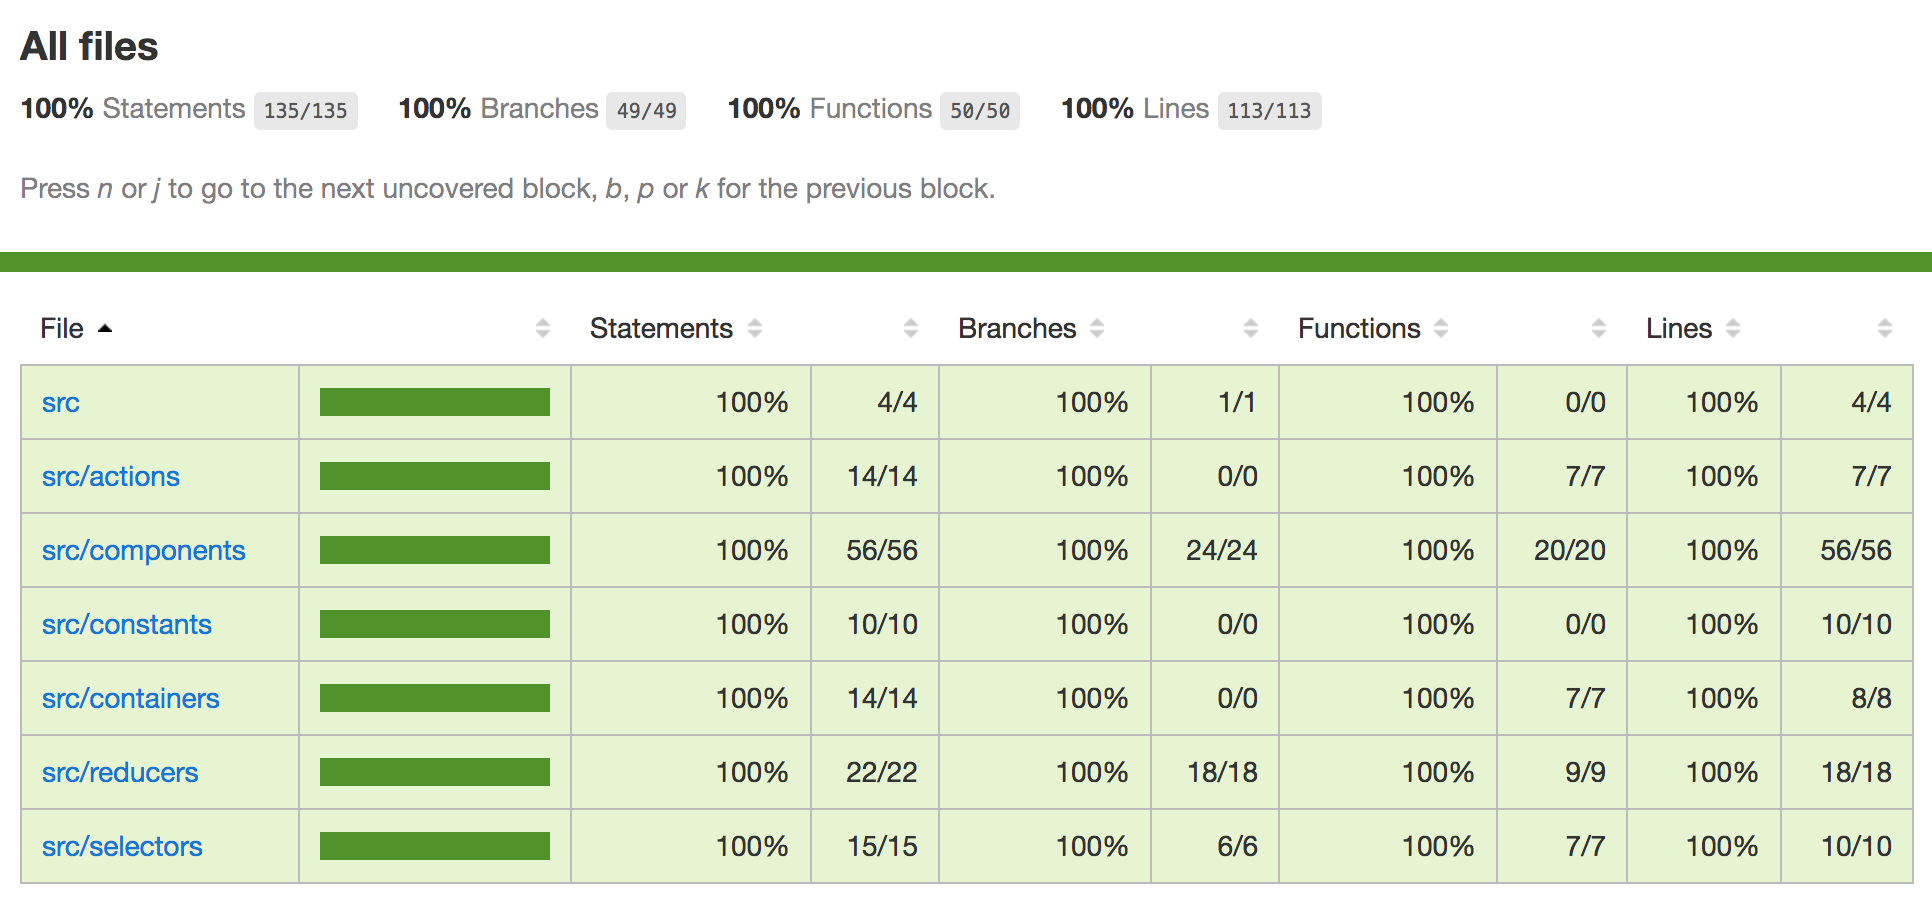
The produced HTML report shows 99% code coverage
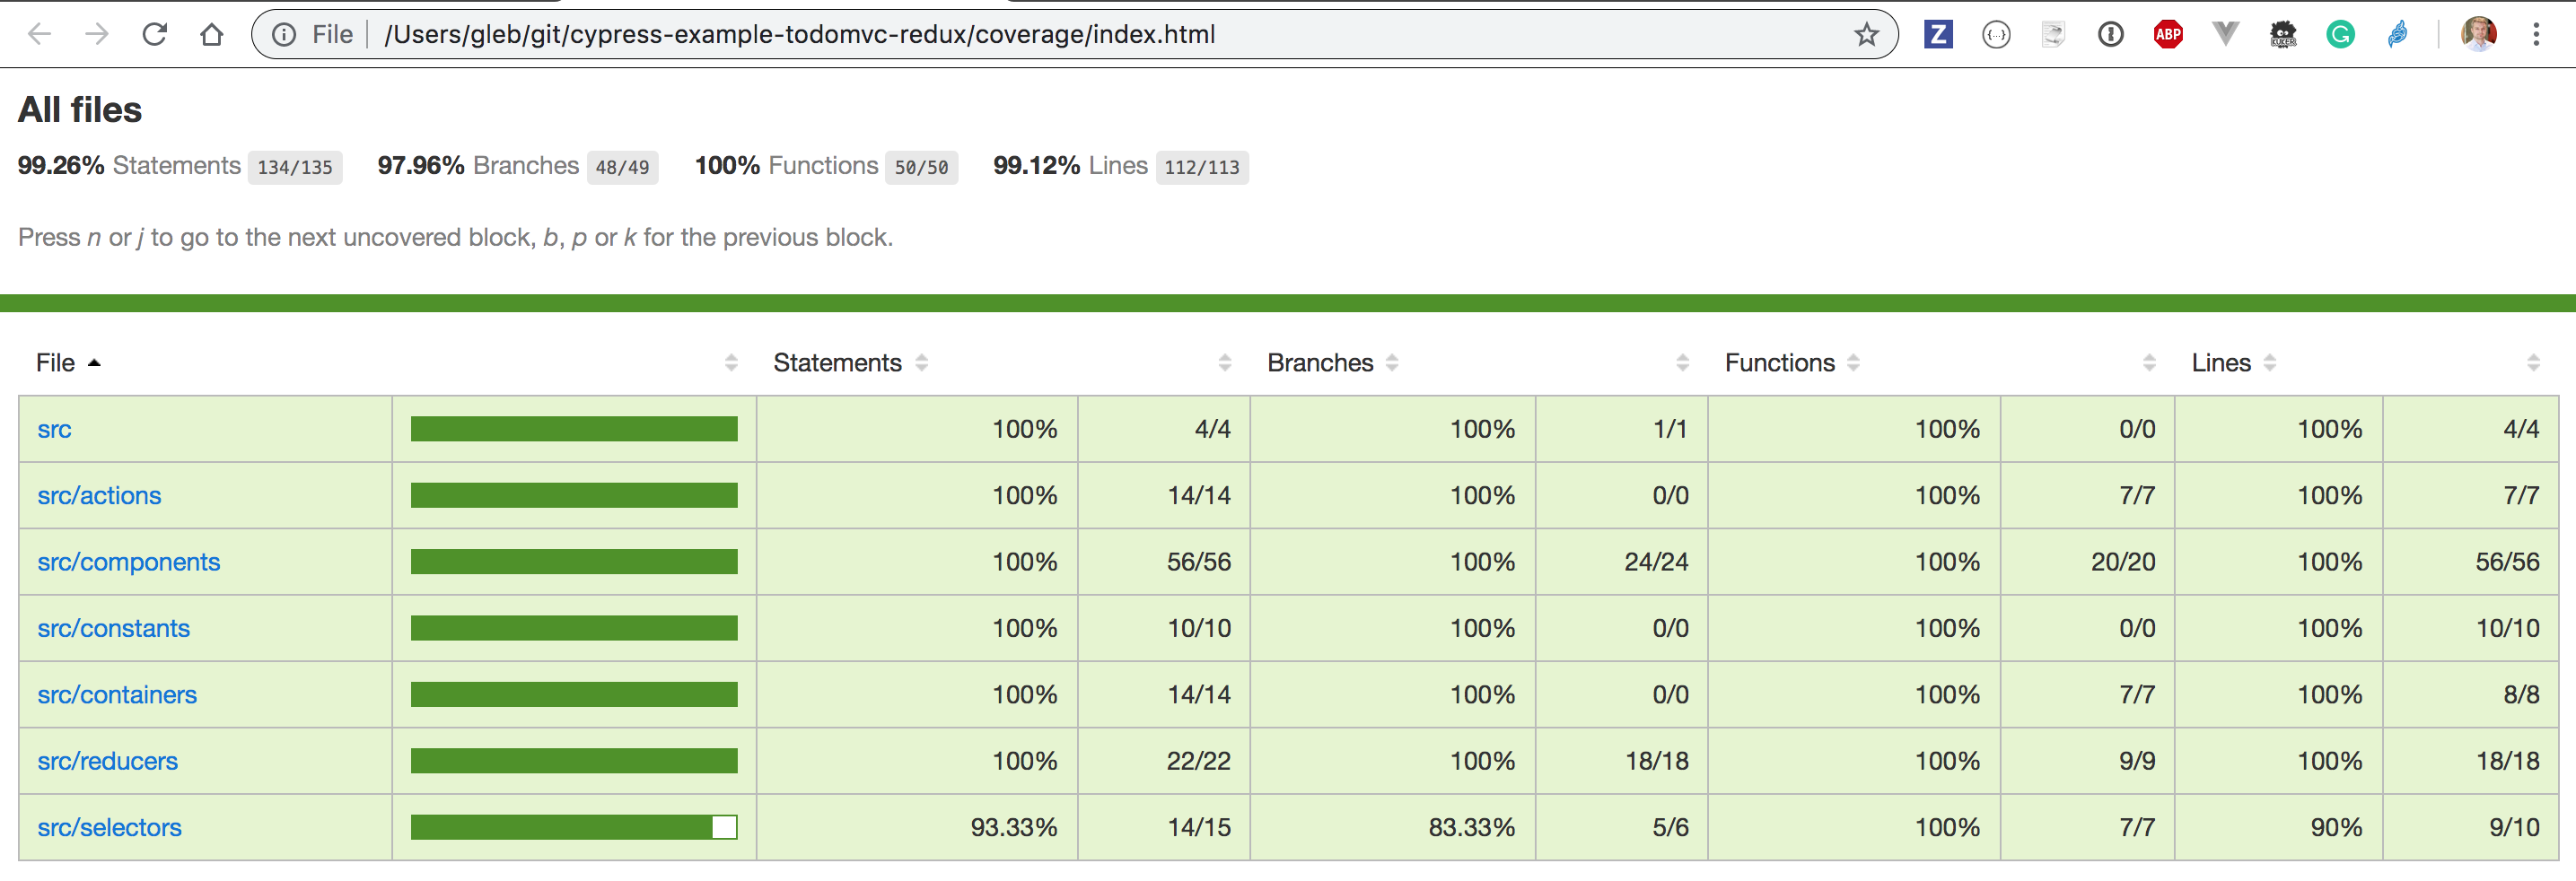
Every source file but 1 is covered at 100%. We can have great confidence in our application, and safely refactor the code knowing that we have a robust set of end-to-end tests.
If possible, we advise implementing visual testing in addition to Cypress functional tests to avoid CSS and visual regressions.
Combining code coverage from parallel tests
If you execute Cypress tests in parallel, each machine ends up with a code coverage report that only shows a portion of the code exercised. Typically an external code coverage service would merge such partial reports for you. If you do want to merge the reports yourself:
- on every machine running Cypress tests, copy the produced code coverage report into a common folder under a unique name to avoid overwriting it
- after all E2E tests finish, combine the reports yourself using
nyc mergecommand
You can find an example of merging partial reports in our cypress-io/cypress-example-conduit-app
E2E and unit code coverage
Let's look at the one file that has a "missed" line. It is the
src/selectors/index.js file shown below.
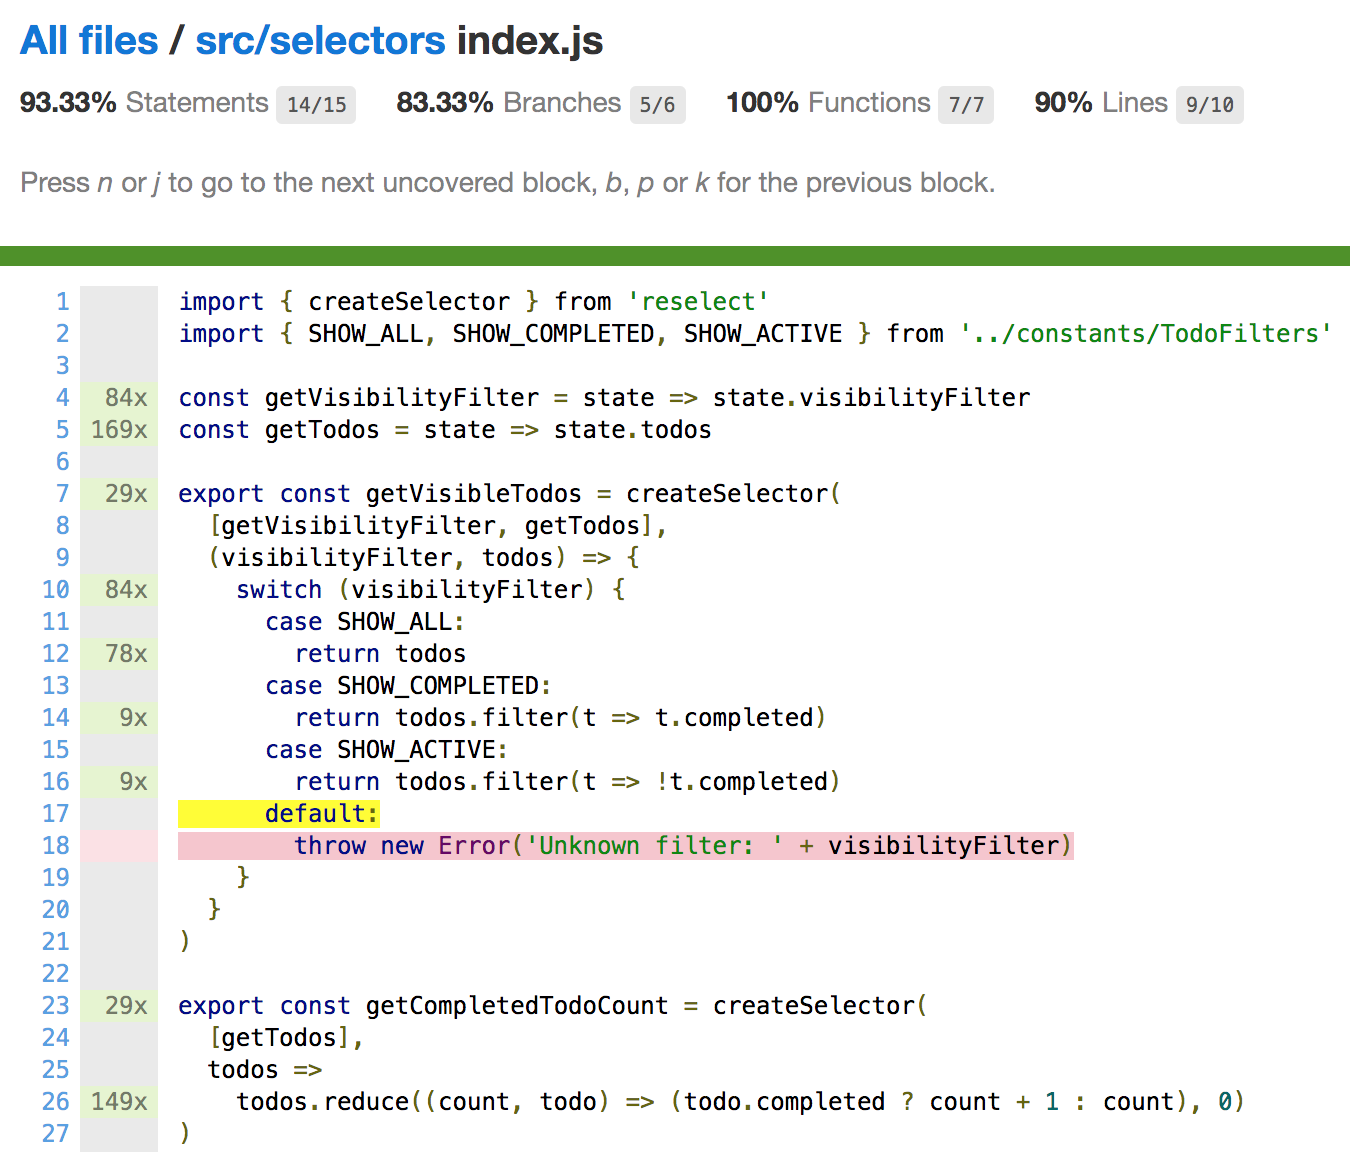
The source line not covered by the end-to-end tests shows an edge case NOT reachable from the UI. Yet this switch case is definitely worth testing - at least to avoid accidentally changing its behavior during future refactoring.
We can directly test this piece of code by importing the getVisibleTodos
function from the Cypress spec file. In essence we are using Cypress as a unit
testing tool (find more unit testing recipes
here).
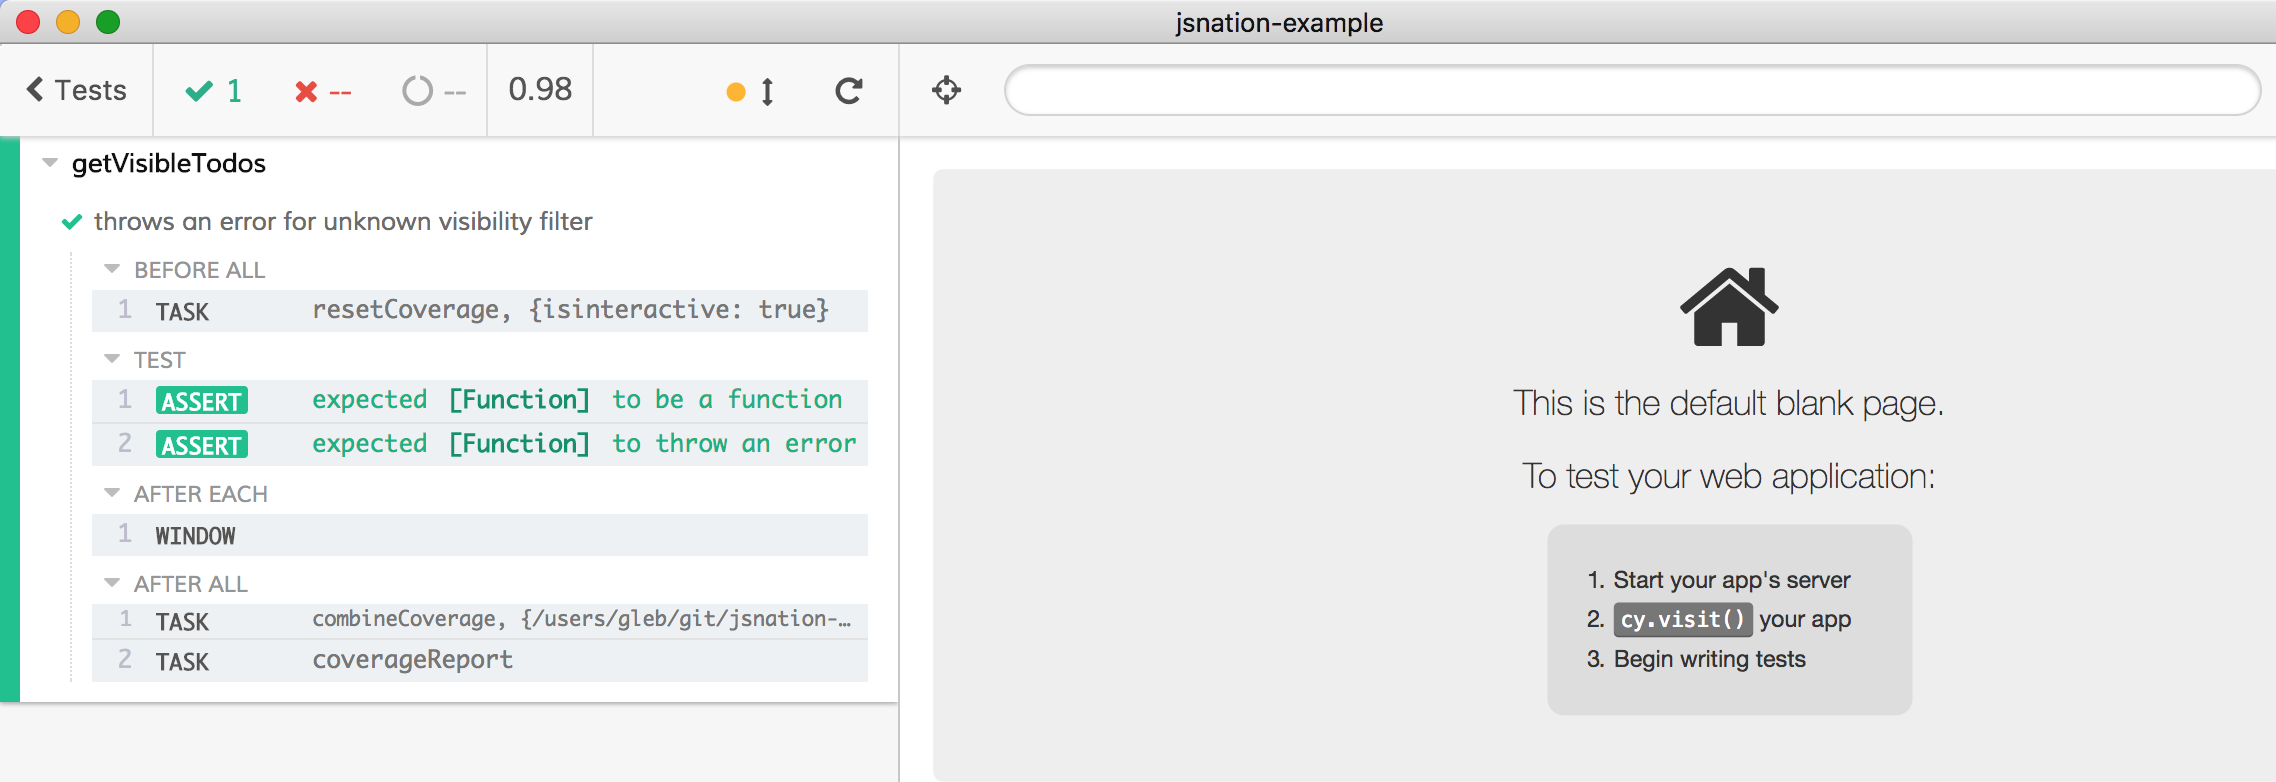
Here is our test to confirm that the error is thrown.
// cypress/e2e/selectors.cy.js
import { getVisibleTodos } from '../../src/selectors'

describe('getVisibleTodos', () => {
  it('throws an error for unknown visibility filter', () => {
    expect(() => {
      getVisibleTodos({
        todos: [],
        visibilityFilter: 'unknown-filter',
      })
    }).to.throw()
  })
})
The test passes, even if there is no web application visited.
Previously we instrumented the application code (either using a build step or inserting a plugin into the Babel pipeline). In the example above, we are NOT loading an application, instead we are only running the test files by themselves.
If we want to collect the code coverage from the unit tests, we need to
instrument the source code of our spec files. The simplest way to do this is
to use the same .babelrc with
babel-plugin-istanbul
and tell the Cypress built-in bundler to use .babelrc when bundling specs. One
can use the
@cypress/code-coverage plugin
again to do this by adding the code below to the
setupNodeEvents function.
- cypress.config.js
- cypress.config.ts
const { defineConfig } = require('cypress')

module.exports = defineConfig({
  // setupNodeEvents can be defined in either
  // the e2e or component configuration
  e2e: {
    setupNodeEvents(on, config) {
      require('@cypress/code-coverage/task')(on, config)
      // tell Cypress to use .babelrc file
      // and instrument the specs files
      // only the extra application files will be instrumented
      // not the spec files themselves
      on('file:preprocessor', require('@cypress/code-coverage/use-babelrc'))

      return config
    },
  },
})
import { defineConfig } from 'cypress'

export default defineConfig({
  // setupNodeEvents can be defined in either
  // the e2e or component configuration
  e2e: {
    setupNodeEvents(on, config) {
      require('@cypress/code-coverage/task')(on, config)
      // tell Cypress to use .babelrc file
      // and instrument the specs files
      // only the extra application files will be instrumented
      // not the spec files themselves
      on('file:preprocessor', require('@cypress/code-coverage/use-babelrc'))

      return config
    },
  },
})
For reference, the .babelrc file is shared between the example application and
the spec files, thus Cypress tests are transpiled the same way the application
code is transpiled.
{
  "presets": ["@babel/preset-react"],
  "plugins": ["transform-class-properties", "istanbul"]
}
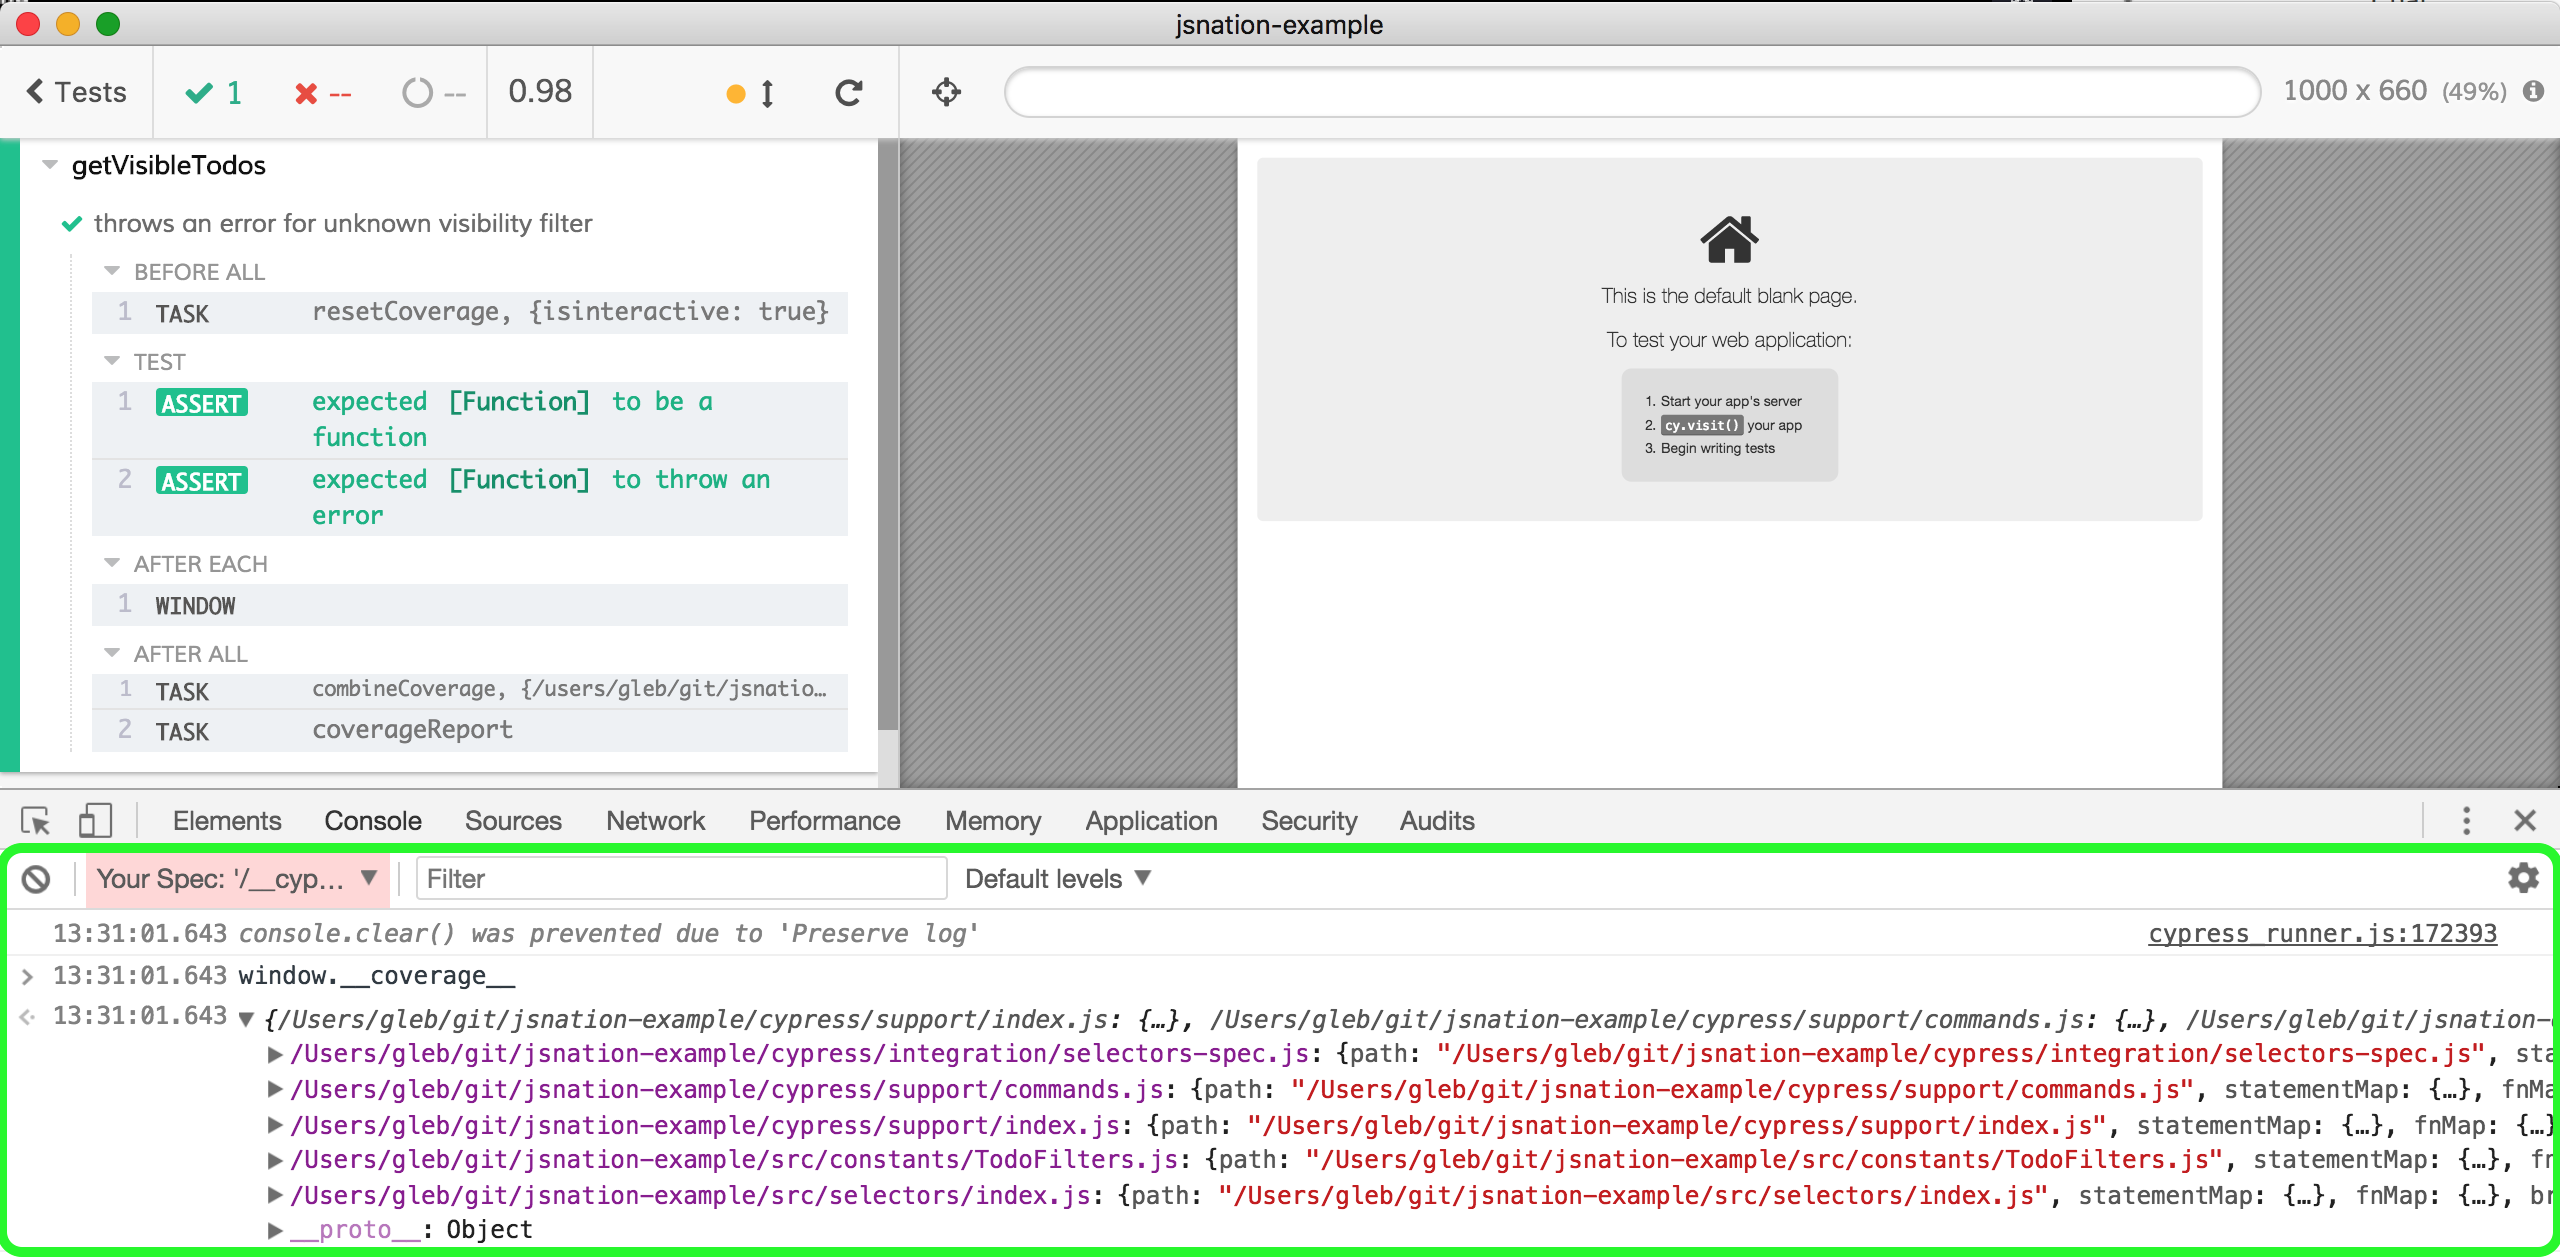
When we run Cypress with
babel-plugin-istanbul
included and inspect the window.__coverage__ object in the spec iframe, we
should see the coverage information for the application source files.
The code coverage information in unit tests and end-to-end tests has the same
format; the
@cypress/code-coverage plugin
automatically grabs both and saves the combined report. Thus we can see the code
coverage from the cypress/e2e/selectors.cy.js file after running the test.
Our unit test is hitting the line we could not reach from the end-to-end tests, and if we execute all spec files - we will get 100% code coverage.
Full stack code coverage
A complex application might have a Node back end with its own complex logic. From the front end web application, the calls to the API go through layers of code. It would be nice to track what back end code has been exercised during Cypress end-to-end tests.
Are our end-to-end tests that are so effective at covering the web application code also covering the back end server code?
Long story short: yes. You can collect the code coverage from the back end,
and let the @cypress/code-coverage plugin merge it with the front end
coverage, creating a single full stack report.
The full source code for this section can be found in the cypress-io/cypress-example-conduit-app repository.
You can run your Node server and instrument it using nyc on the fly. Instead of
the "normal" server start command, you can run the command
npm run start:coverage defined in the package.json like this:
{
  "scripts": {
    "start": "node server",
    "start:coverage": "nyc --silent node server"
  }
}
In your server, insert another middleware from @cypress/code-coverage. If you
use an Express server, include middleware/express:
const express = require('express')
const app = express()

require('@cypress/code-coverage/middleware/express')(app)
If your server uses hapi, include middleware/hapi
if (global.__coverage__) {
  require('@cypress/code-coverage/middleware/hapi')(server)
}
Tip: you can conditionally register the endpoint only if there is a global code coverage object, and you can exclude the middleware code from the coverage numbers:
/* istanbul ignore next */
if (global.__coverage__) {
  require('@cypress/code-coverage/middleware/hapi')(server)
}
For any other server type, define a GET /__coverage__ endpoint and return the
global.__coverage__ object.
if (global.__coverage__) {
  // handle "GET __coverage__" requests
  onRequest = (response) => {
    response.sendJSON({ coverage: global.__coverage__ })
  }
}
In order for the @cypress/code-coverage plugin to know that it should request
the back end coverage, add the new endpoint to the Cypress configuration
environment settings under env.codeCoverage.url key. For example, if the
application back end is running at port 3000 and we are using the default "GET
/coverage" endpoint, set the following:
- cypress.config.js
- cypress.config.ts
const { defineConfig } = require('cypress')

module.exports = defineConfig({
  env: {
    codeCoverage: {
      url: 'http://localhost:3000/__coverage__',
    },
  },
})
import { defineConfig } from 'cypress'

export default defineConfig({
  env: {
    codeCoverage: {
      url: 'http://localhost:3000/__coverage__',
    },
  },
})
From now on, the front end code coverage collected during end-to-end tests will be merged with the code coverage from the instrumented back end code and saved in a single report. Here is an example report from the cypress-io/cypress-example-conduit-app example:
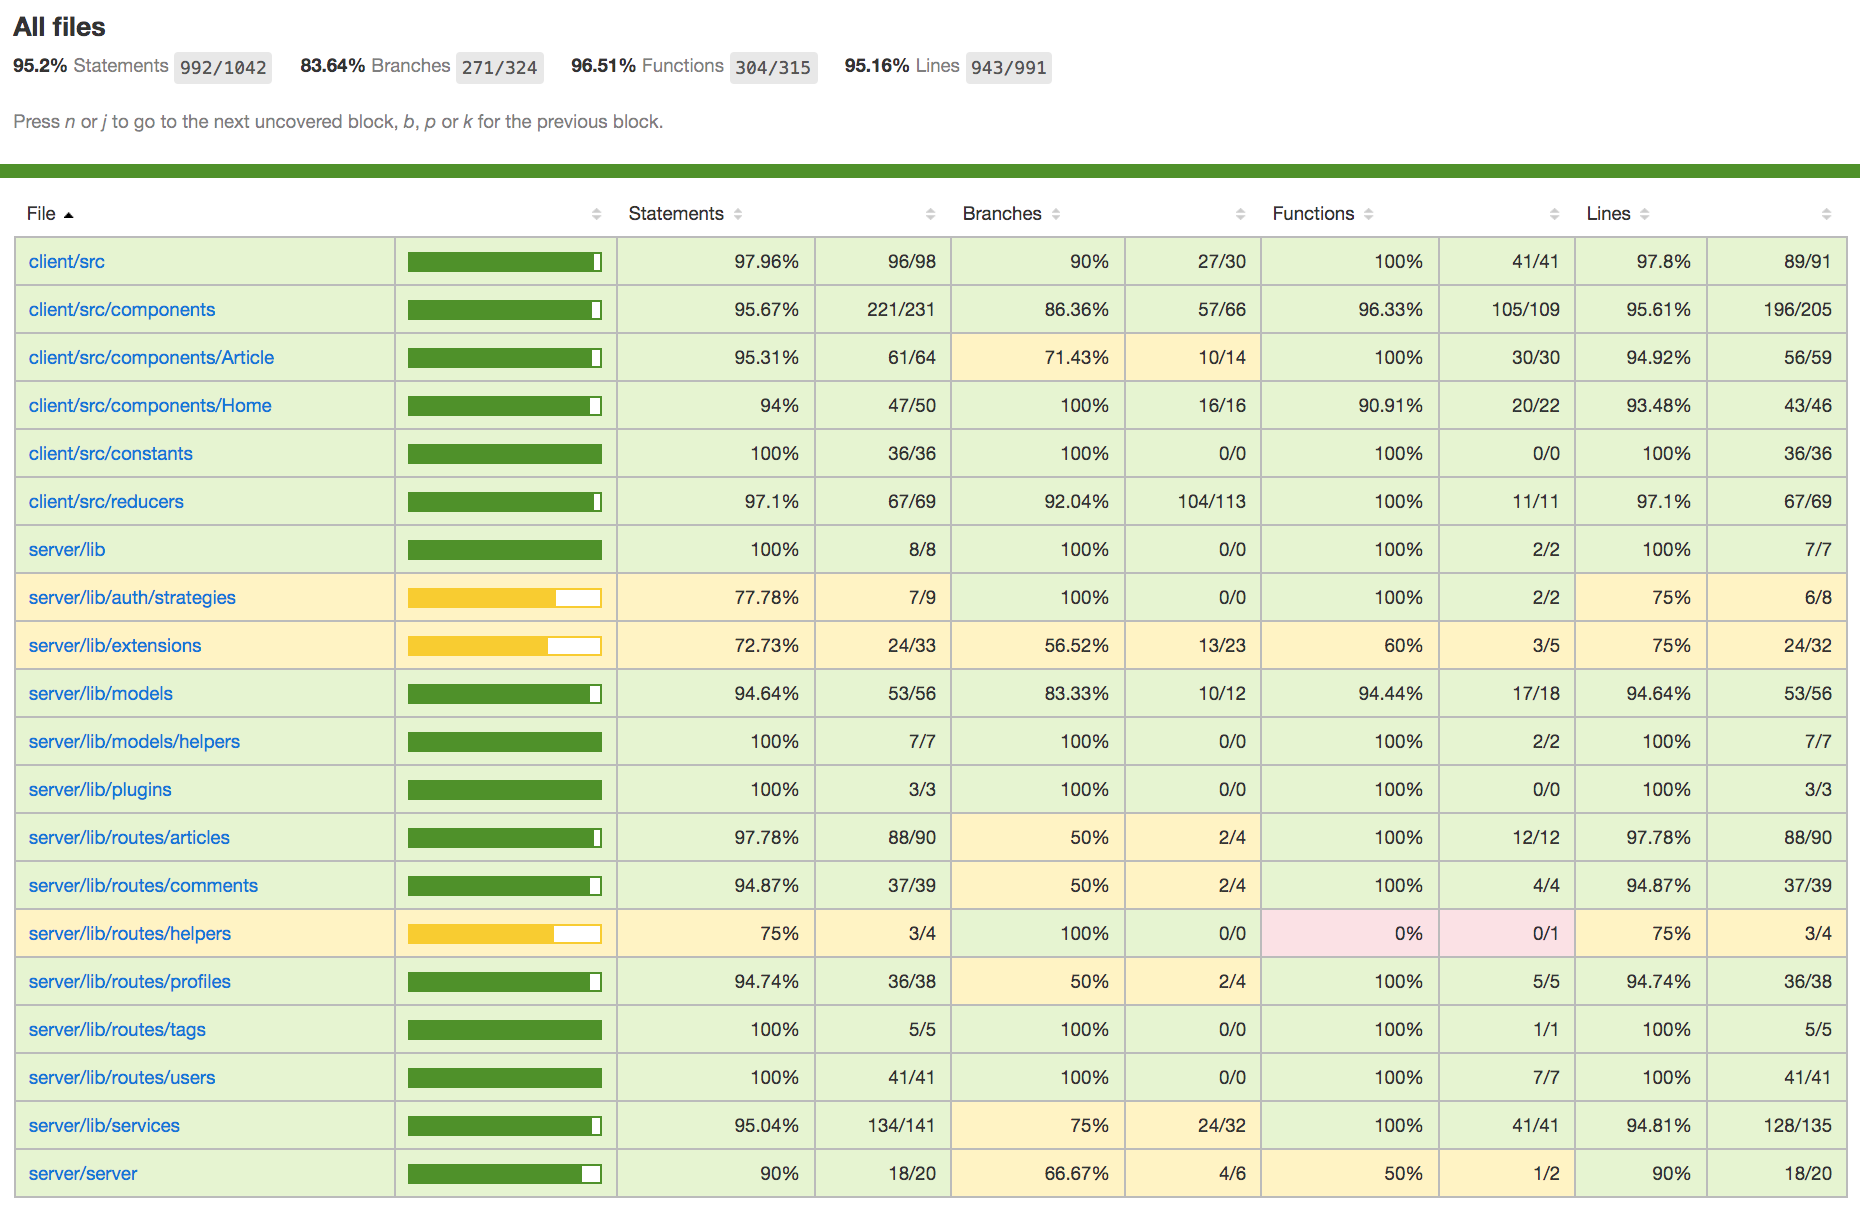
You can explore the above combined full stack coverage report at the coveralls.io/github/cypress-io/cypress-example-conduit-app dashboard. You can also find full stack code coverage in our RealWorld App.
Even if you only want to measure the back end code coverage Cypress can help. Read the blog post Back end Code Coverage from Cypress API tests for the full tutorial.
Future work
We are currently exploring two additional features for code coverage during end-to-end tests. First, we would like to avoid the "manual" instrumentation step using the Istanbul.js library and instead capture the native code coverage that can be collected by the Chrome browser's V8 engine. You can find a proof-of-concept example in bahmutov/cypress-native-chrome-code-coverage-example repository.
Second, we would like to capture the code coverage from the locally running back end server that is serving the front end web application and handles the API requests from the web application under test. We believe that E2E tests with additional API tests that Cypress can perform can effectively cover a lot of back end code.
Videos
There is a series of videos we have recorded showing code coverage in Cypress
How to instrument react-scripts web application for code coverage
Get code coverage reports from Cypress tests
Excluding code from code coverage reports
Check code coverage robustly using 3rd party tool
Adding code coverage badge to your project
Show code coverage in commit status check
Checking code coverage on pull request
Examples
You can find full examples showing different code coverage setups in the following repositories:
- cypress-io/cypress-realworld-app or RWA is a full stack example application that demonstrates best practices and scalable strategies with Cypress in practical and realistic scenarios. The RWA achieves full code coverage with end-to-end tests across multiple browsers and device sizes.
- cypress-io/cypress-example-todomvc-redux is the example code used in this guide.
- cypress-io/cypress-example-conduit-app shows how to collect the coverage information from both back and front end code and merge it into a single report.
- bahmutov/code-coverage-webpack-dev-server shows how to collect code coverage from an application that uses webpack-dev-server.
- bahmutov/code-coverage-vue-example collects code coverage for Vue.js single file components.
- lluia/cypress-typescript-coverage-example shows coverage for a React App that uses TypeScript.
- bahmutov/cypress-and-jest shows how to run Jest unit tests and Cypress unit tests, collecting code coverage from both test runners, and then produce a merged report.
- rootstrap/react-redux-base
shows an example with a realistic webpack config. Instruments the source code
using
babel-plugin-istanbulduring tests. - skylock/cypress-angular-coverage-example
shows an Angular 8 + TypeScript application with instrumentation done using
ngx-build-plus. - bahmutov/testing-react shows how
to get code coverage for a React application created using
CRA v3without ejectingreact-scripts. - bahmutov/next-and-cypress-example
shows how to get back end and front end coverage for a Next.js project.
middleware/nextjs.js. - ericorruption/cypress-code-coverage-typescript-webpack-ts-loader
shows how to collect coverage for a TypeScript + webpack project using
ts-loaderinstead ofbabel-loader.
Find the full list of examples linked in cypress-io/code-coverage#external-examples.