Cypress App
What you'll learn
- The names and purposes of the visual parts of Cypress
- How to use the Selector Playground for targeting elements
- How to debug tests using the built-in features of Cypress
Overview
The Cypress desktop app has powerful features for creating, configuring, browsing, and most importantly running your tests. We'll touch on a few of the different functions before moving on to the Test Runner, the heart of the Cypress testing experience.
When you configure the open source Cypress app to record tests to Cypress Cloud, you'll see data from your latest recorded runs directly in the Cypress app. This increased visibility into your test history allows you to debug your tests faster and more effectively, all within your local workflow.
The data used by these features is pulled from Cypress Cloud, so they will only reflect test results that were recorded.
If you're not sure whether you're logged in, you can always check using the profile control in the top right of the window.
Launchpad
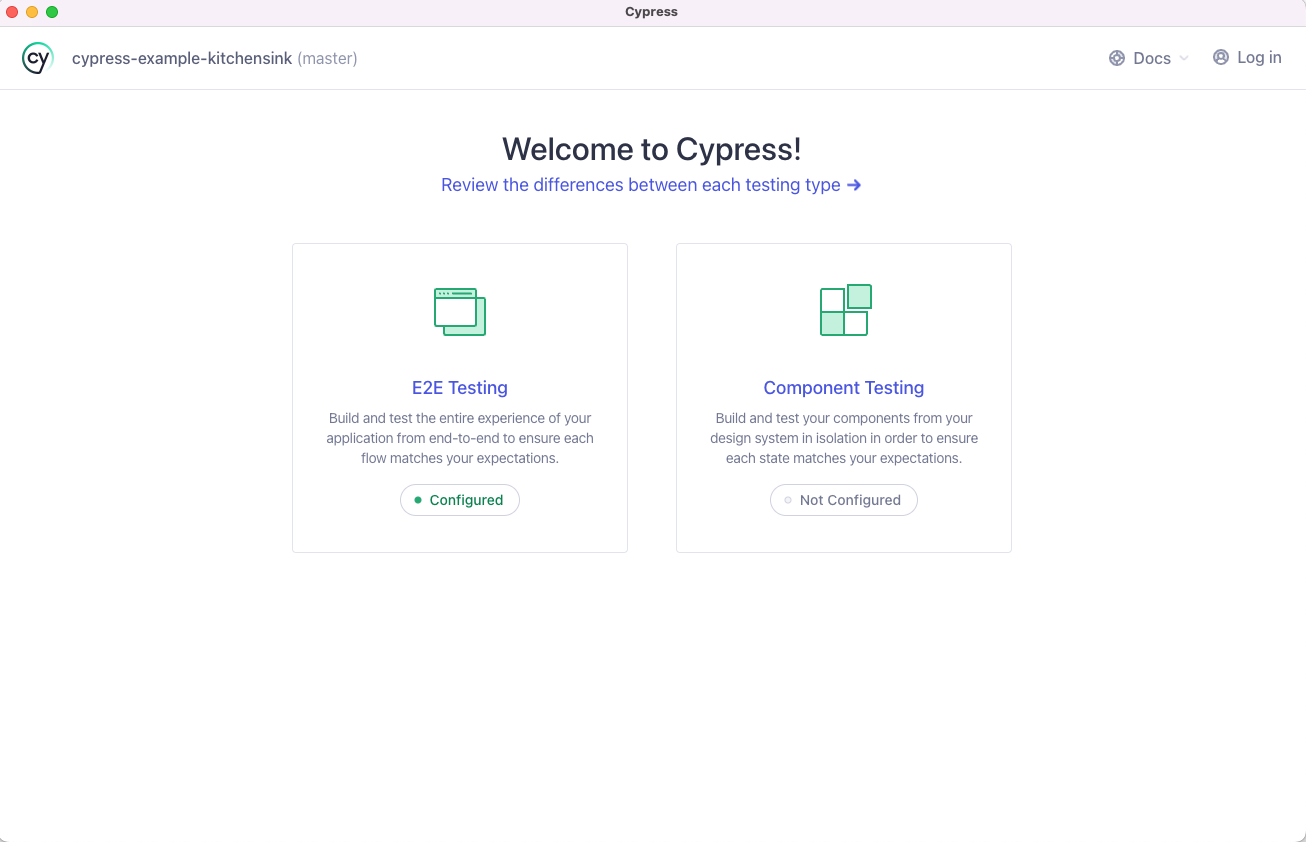
The Launchpad is your portal to Cypress, helping with onboarding, choosing a testing type and launching a browser.
Once you get comfortable with Cypress you might find you don't need the
Launchpad any more. In this case
you can run cypress open with the --browser and --component or --e2e options
to go straight to the Specs page.
Specs
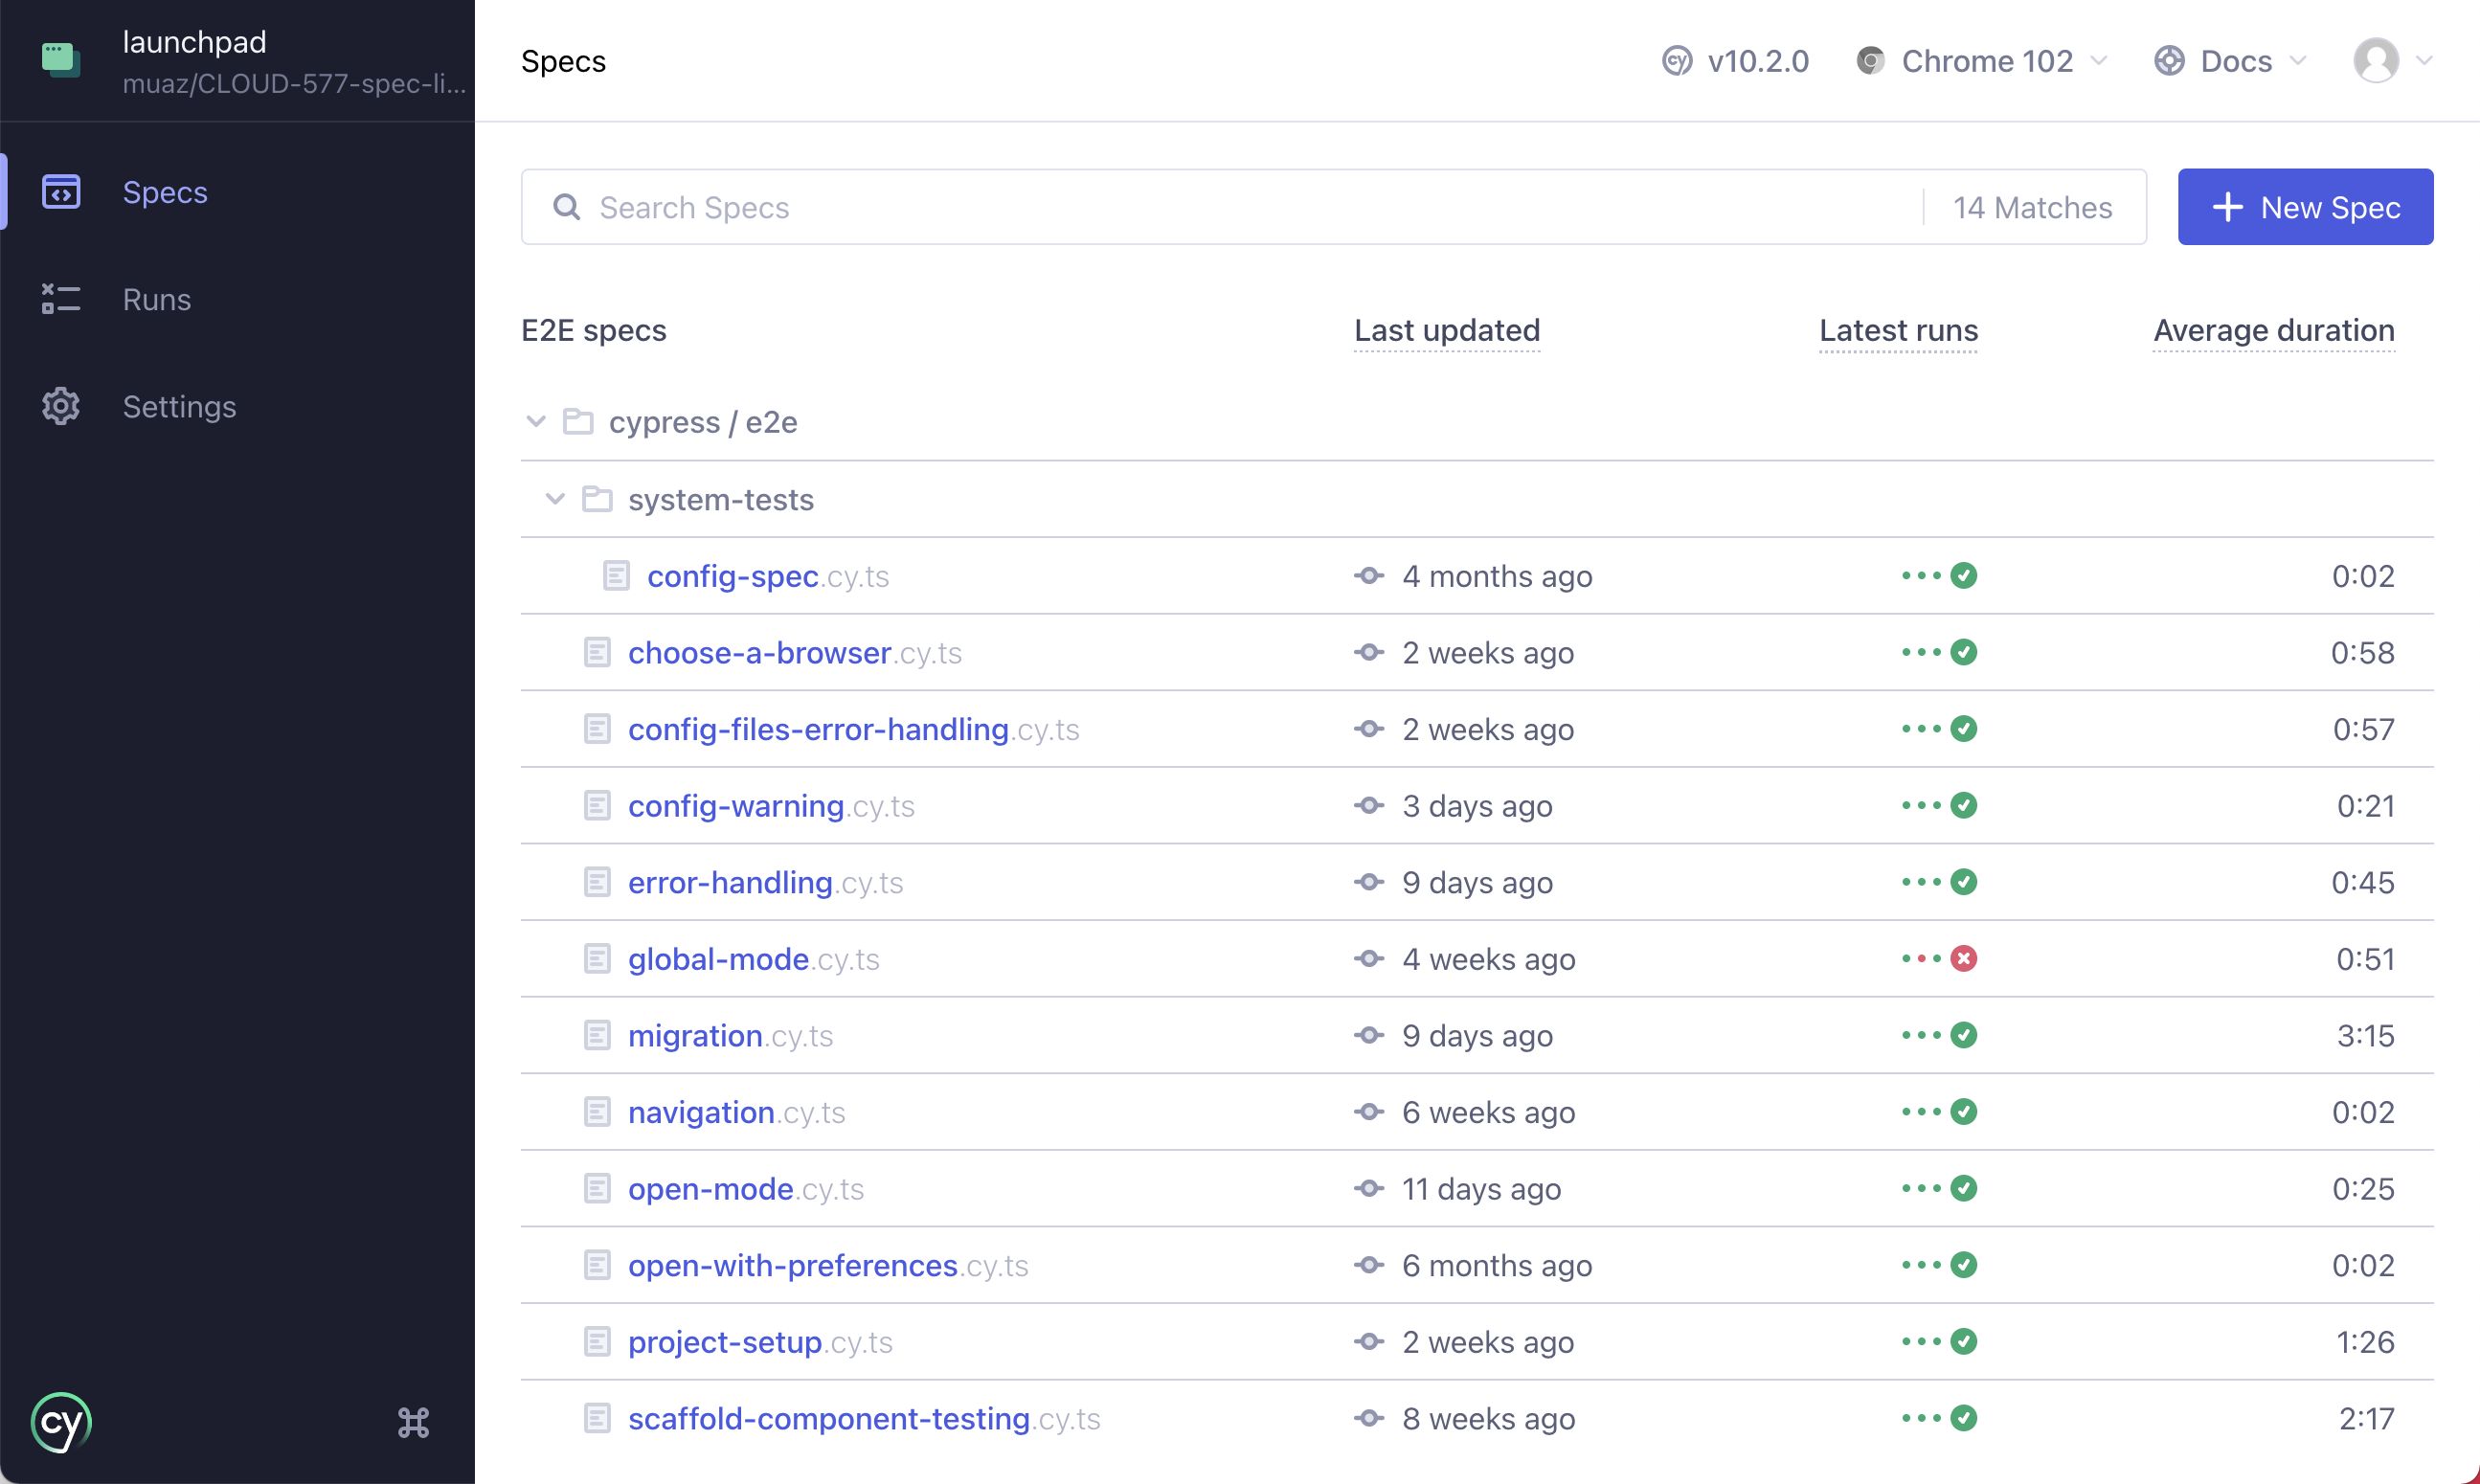
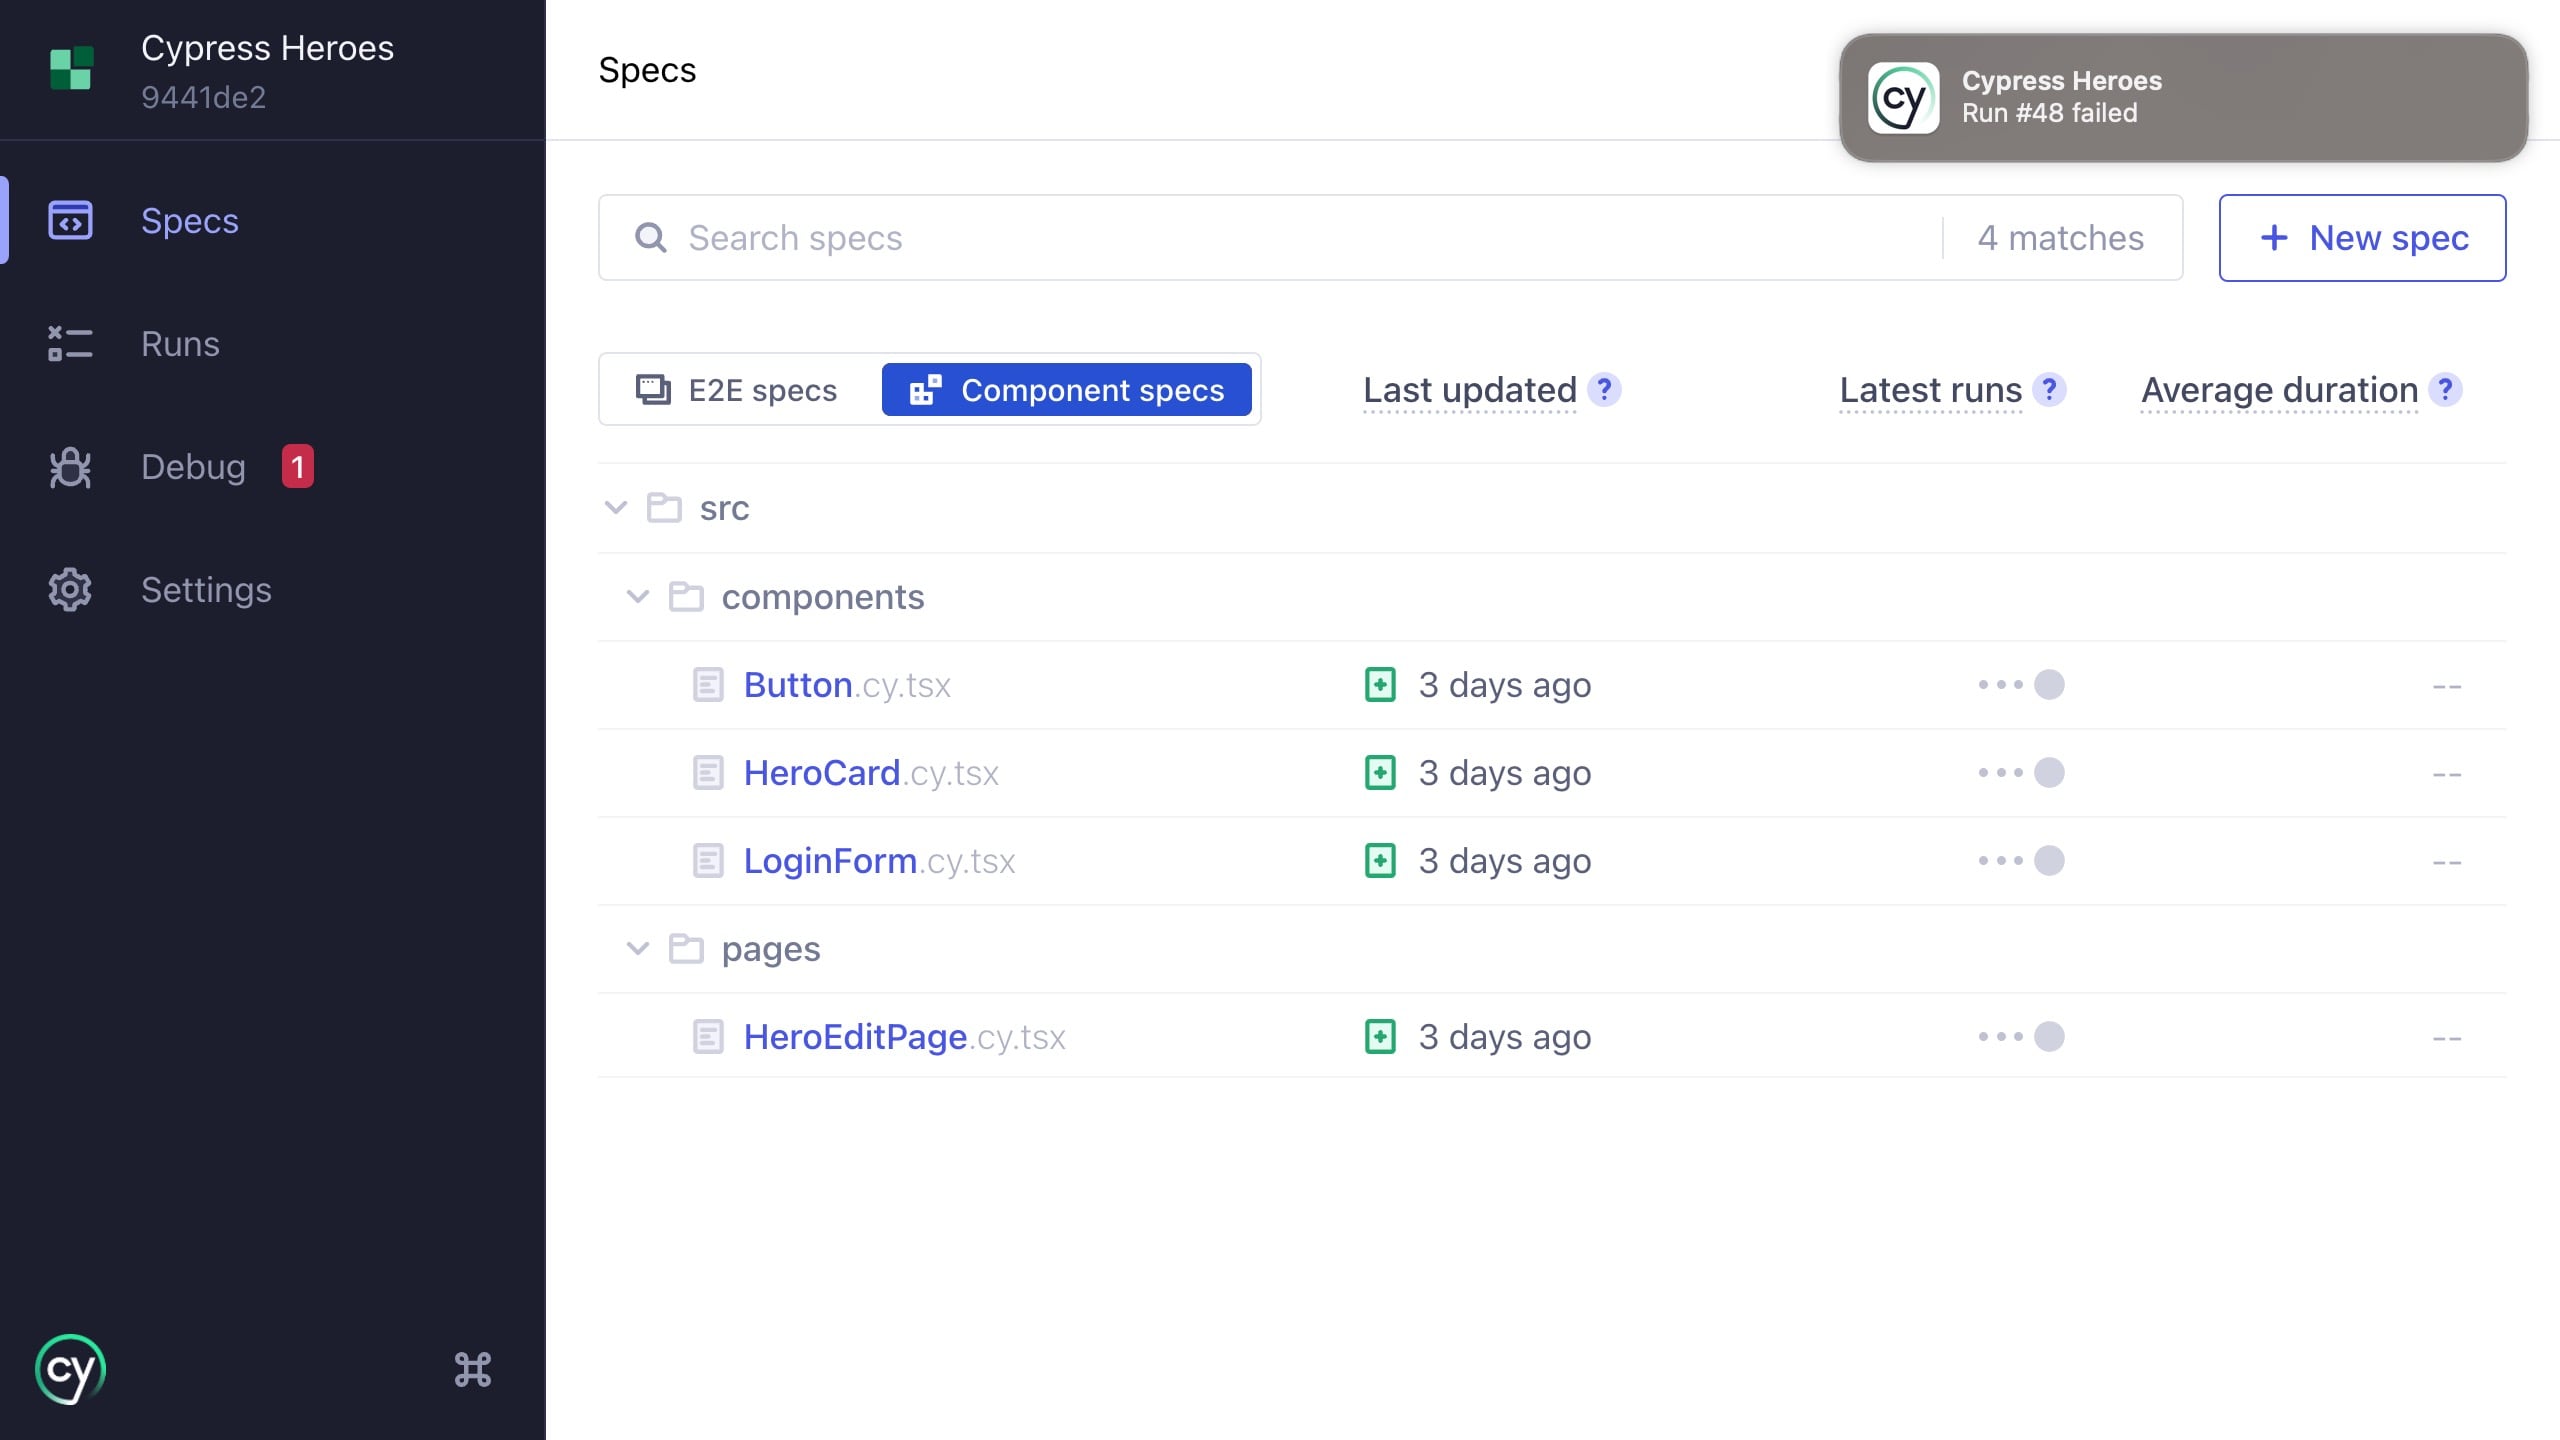
On choosing your browser in the Launchpad, you'll be presented with a list of your specs, their names, locations, and information about your latest recorded runs. Here you can launch specs by clicking them, create new blank or example specs, or search specs by name (handy for large test suites).
We've made the following spec data available directly on the Specs page:
Last updated
This column tells you when the code of this spec was last updated, using local file data from git or your own filesystem. It surfaces the change history of your tests, so you can quickly find the most relevant specs as you’re browsing your project.
This column will vary from machine to machine, as it reflects the state of the code as stored on that computer.
Latest runs
This column shows the last time the spec was run, and the last four returned statuses. Results are scoped to your current git branch if available, falling back to the default branch if not, then finally all branches.
With this intelligence you can monitor, run, and fix tests locally within CI workflows, and then further dig into your results by clicking through to Cypress Cloud.
The runs data is sourced from Cypress Cloud (see note above) so it will be the same everywhere.
Average duration
This column indicates the time taken to run the entire spec file, averaged over the last four runs, so that you can quickly identify and take action to improve the performance of your long-running tests.
Again, this analysis comes from Cypress Cloud.
Flake annotation
A test is considered to be flaky when it can pass and fail across multiple retry attempts without any code changes.
Specs with flaky tests are flagged with an indicator beside the spec name. This means you can easily discern which areas of your application might result in an unreliable user experience.
The flake indicator will display if any tests in the given spec have been flaky in your latest runs (limited to 4). Hovering over the indicator will show a tooltip with the following analytics, based off the last 50 runs:
- Rate (flaky runs divided by total runs)
- Severity (flaky rate at a glance)
- Last flaky (how many runs ago)
Clicking on the flake indicator will take you to the spec’s Flaky Test Analytics in Cypress Cloud.
Running Specs
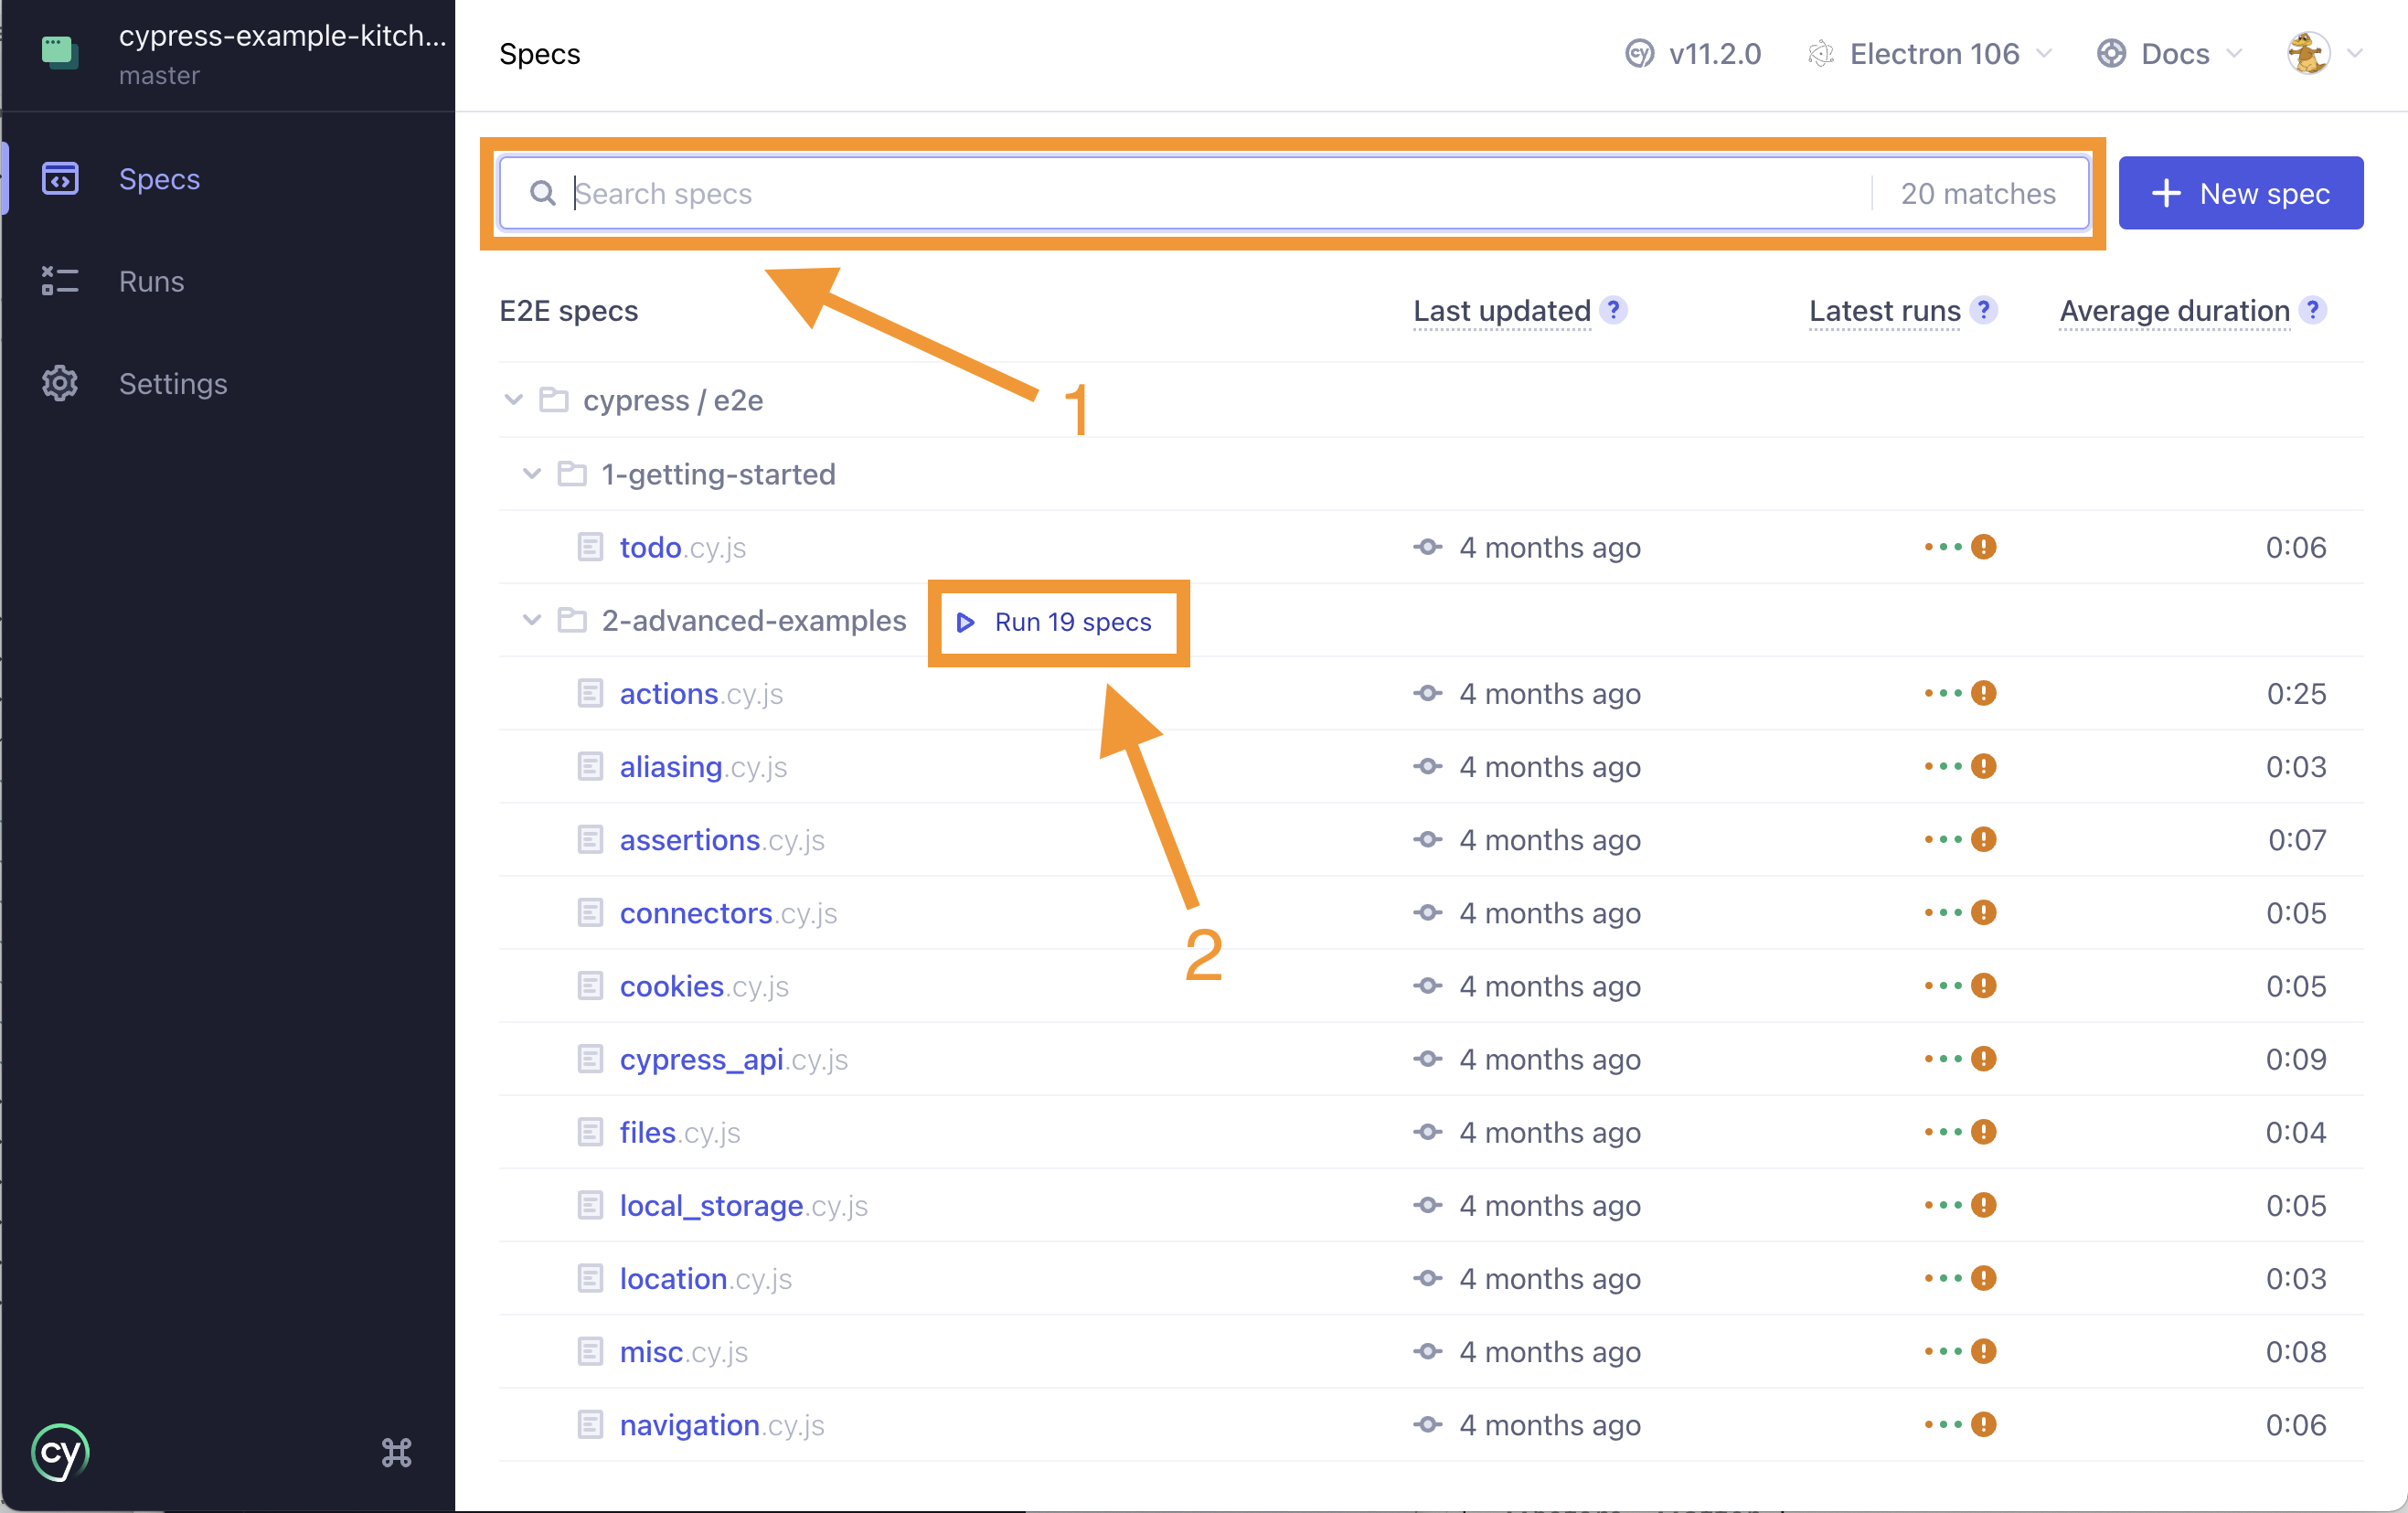
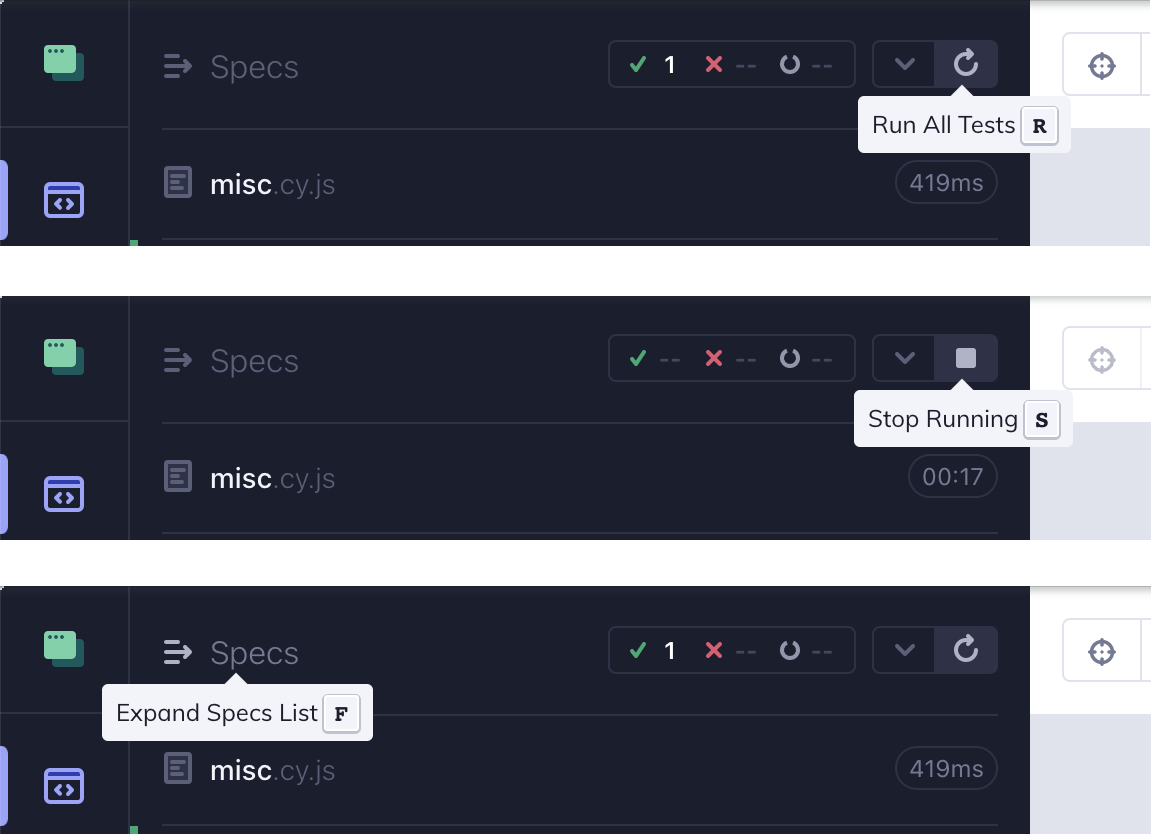
To run a spec, simply click the row with the spec you would like to run. You will be taken to the Test Runner and the spec will execute. You can narrow down the list of specs by typing into the search bar (1).
It is also possible to run multiple specs sequentially using the
experimentalRunAllSpecs
(2).
experimentalRunAllSpecs currently works with End to End Testing.
Running multiple specs sequentially is currently an experimental feature and it may change in the future. There are some known limitations outlined in this GitHub Discussion.
Running a large number of specs sequentially can consume more resources.
Runs
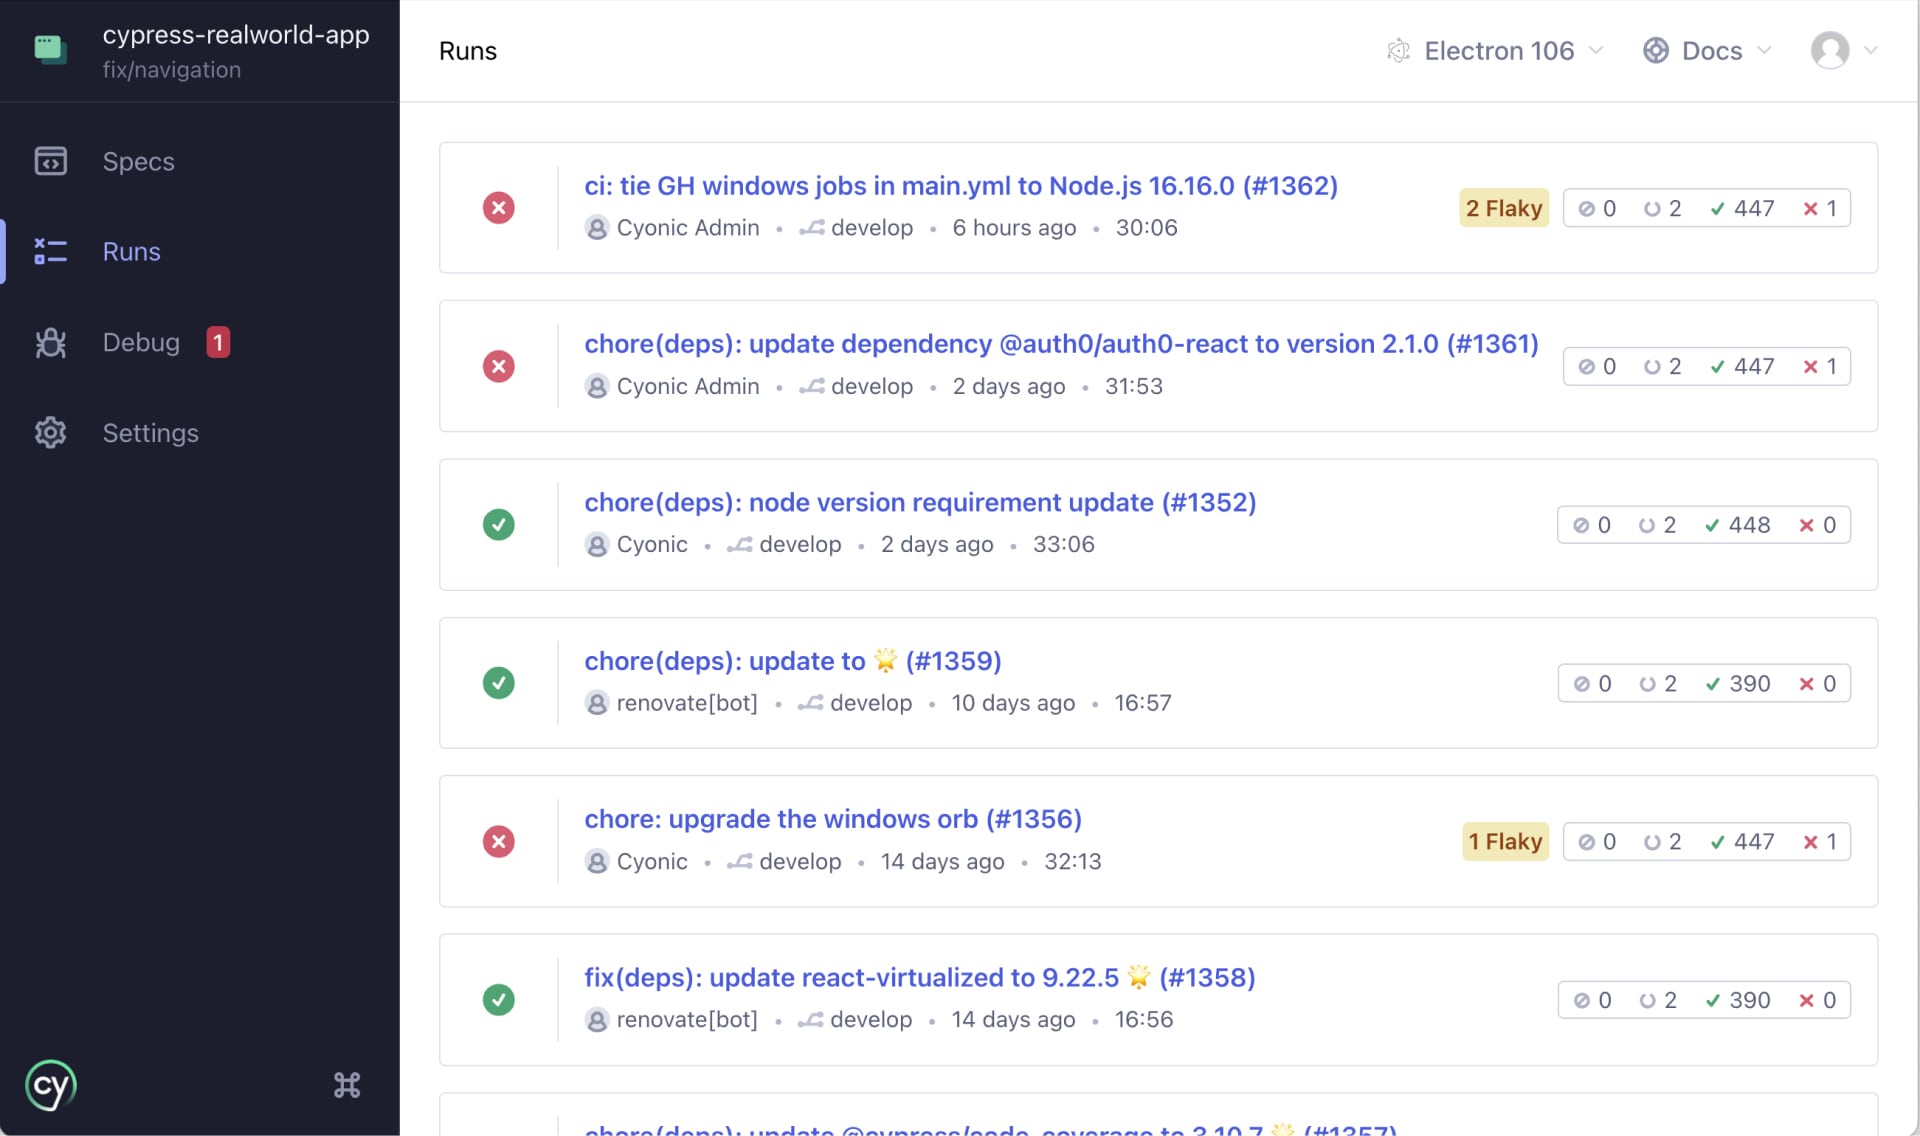
This screen shows detailed information about the most recently recorded test runs to Cypress Cloud, showing the latest first.
Cypress uses Git to show runs for your branch. Ensure that version control is properly configured and that you are sending Git information to Cypress Cloud. If no runs are found for your current branch, all runs for your project are shown as a fallback.
The title of each run is taken from the git commit message for that change, and clicking on it will take you to the corresponding run page in Cypress Cloud.
Debug
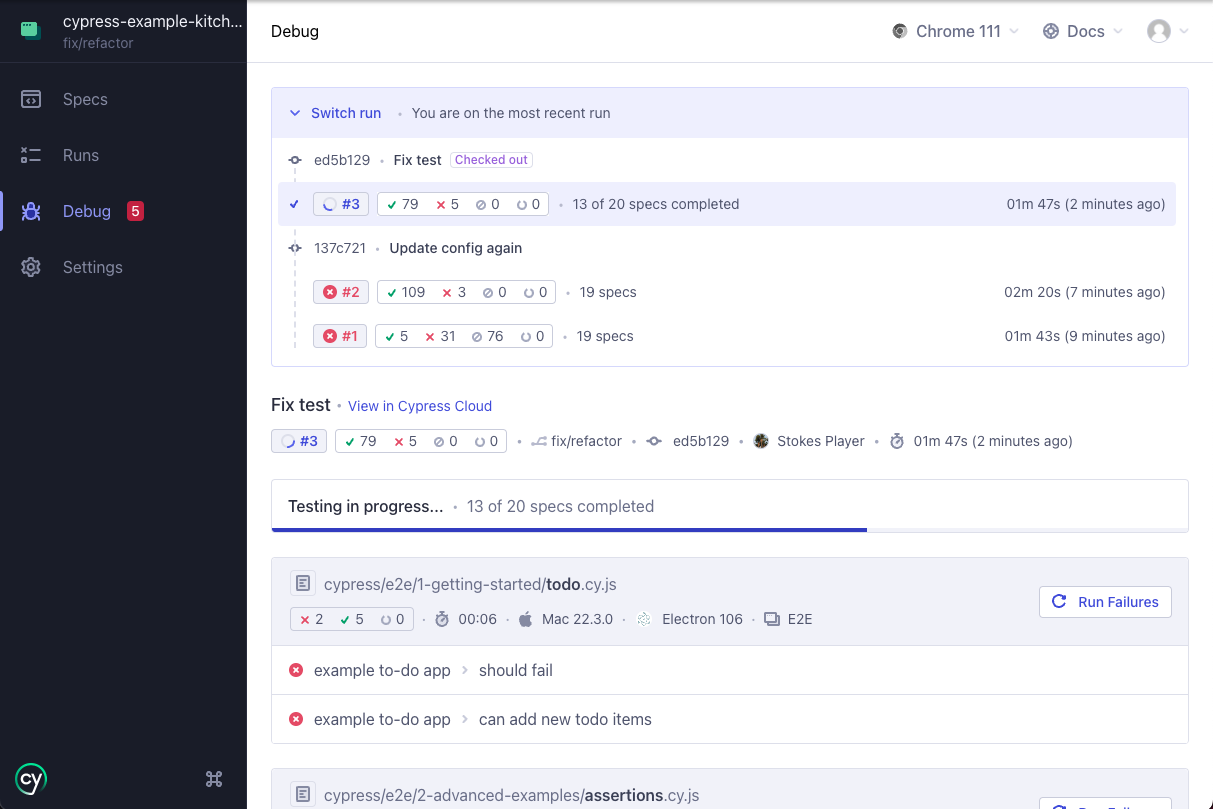
The Debug page allows you to easily debug failed CI test runs from within the Cypress app. From this page, you can review, rerun, and debug failed CI test runs that are recorded to Cypress Cloud (see note above) - all without leaving the Cypress app.
This feature eliminates the tedious process of switching between Cypress, your local editor, and CI output, in order to fix failed tests. It does this by enabling you to use the Test Runner to run only the tests that failed in your last recorded test run, as well as review the Test Replay and other artifacts like screenshots, videos, and logs from your tests.
The Debug page shows the latest completed
test run that matches the HEAD commit
(the commit currently checked out in the working directory) of your local
project. Users can see and switch to relevant runs within the Debug page. If no
run is found for your current commit, then Cypress shows the most recent run in
your branch's history up until the current commit. The first 100 failed
tests are listed, with a link to Cypress Cloud to review the full run.
To use this feature, you must ensure that git is properly configured for your
project and that you are sending git information to Cypress Cloud. Under some
environment setups (e.g. docker/docker-compose), you may have to pass git
information using
custom environment variables.
Cloud Run Notifications
You can receive notifications in the Cypress app for recorded runs directly from Cypress Cloud. Learn more about Cloud Run Notifications.
Test Runner
At the core of the app is the Test Runner itself. Cypress runs tests interactively, allowing you to see commands as they execute while also viewing the Application or Component Under Test, and exploring its DOM.
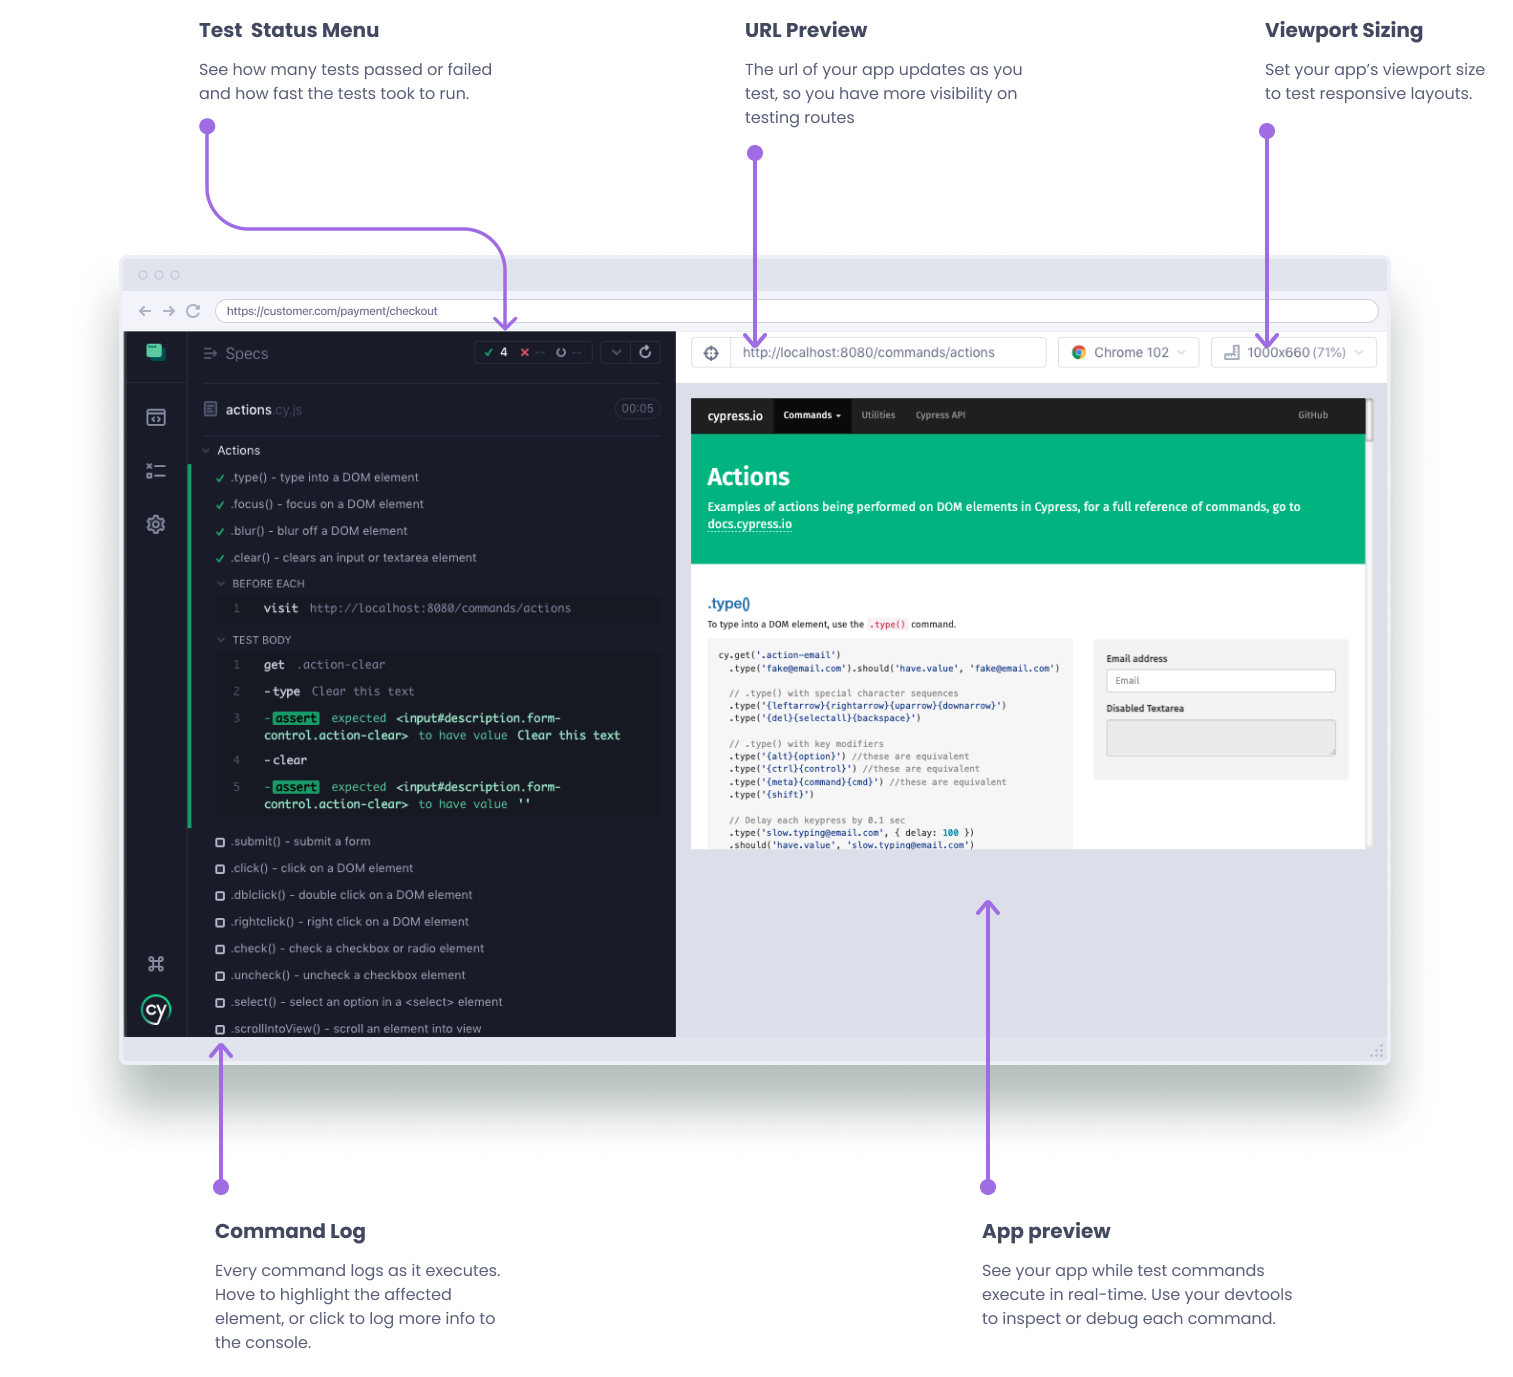
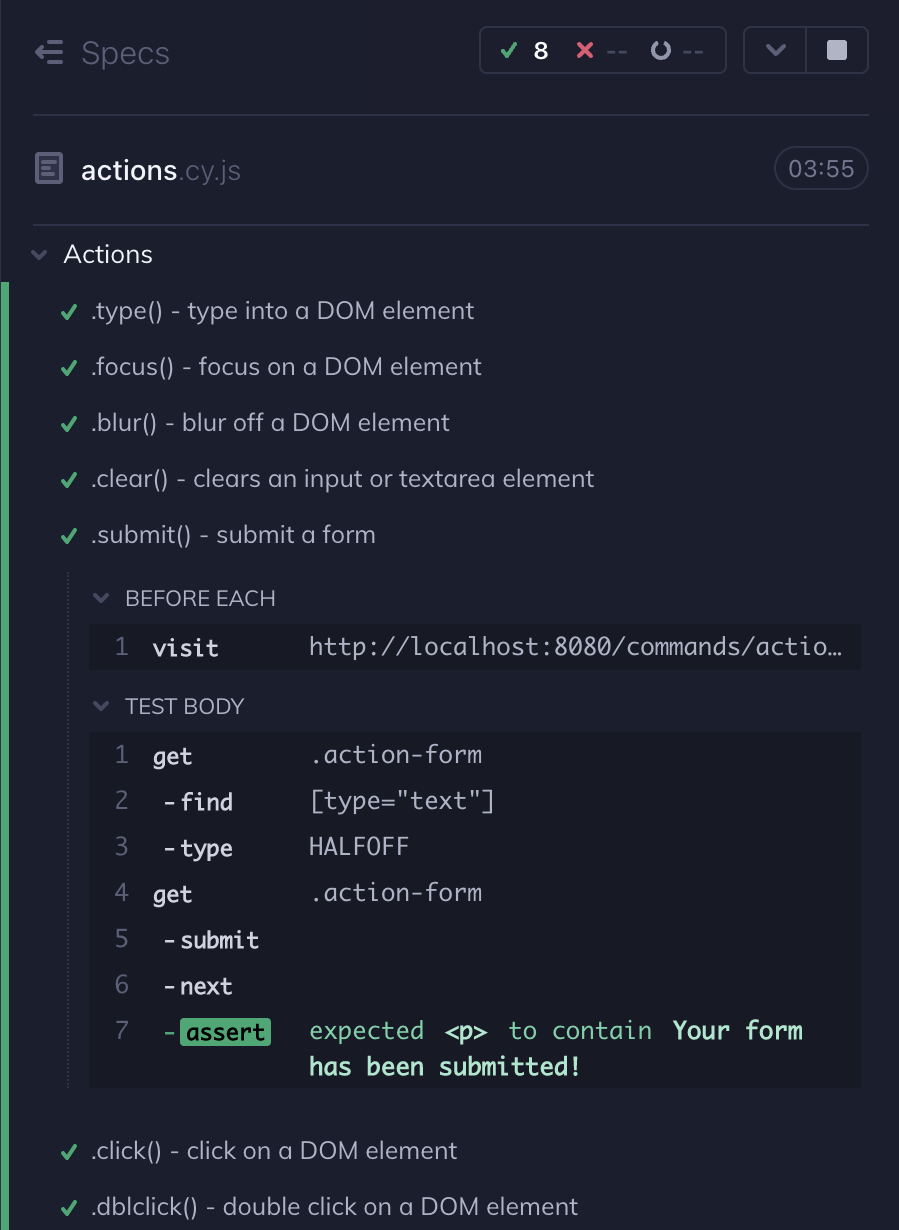
Command Log
The left-hand side of the Test Runner is a visual representation of your test
suite. Each test block is properly nested and each test, when clicked, displays
every Cypress command executed within the test's block as well as any commands
executed in relevant before, beforeEach, afterEach, and after hooks.
Open files in your IDE
There are some places in the Command Log that display a link to the relevant file where the code is located. Clicking on this link will open the file in your preferred file opener.
Time traveling
Each command, when hovered over, restores the Application or Component Under Test (right-hand side) to the state it was in when that command executed. This allows you to time travel back to previous states when testing.
By default, Cypress keeps 50 tests worth of snapshots and command data for
time traveling. If you are seeing extremely high memory consumption in your
browser, you may want to lower the numTestsKeptInMemory in your
Cypress configuration.
In the following example, hovering over the contains
command in the Command Log changes the state of the
AUT preview:
Cypress automatically travels back in time to a snapshot of when a hovered-over
command resolved. Additionally, since cy.contains()
finds DOM elements on the page, Cypress also highlights the element and scrolls
it into view (to the top of the page).
Also note that as we hover over the contains
command, Cypress reverts back to the URL that was present when the snapshot was
taken.
Pinning snapshots
Each command, when clicked on, displays extra information in the dev tools console. Clicking also pins the Application or Component Under Test (right-hand side) to its previous state, or snapshot, when the command executed.
In the following example, clicking on the CLICK command highlights it in
purple, and does three other things worth noting:
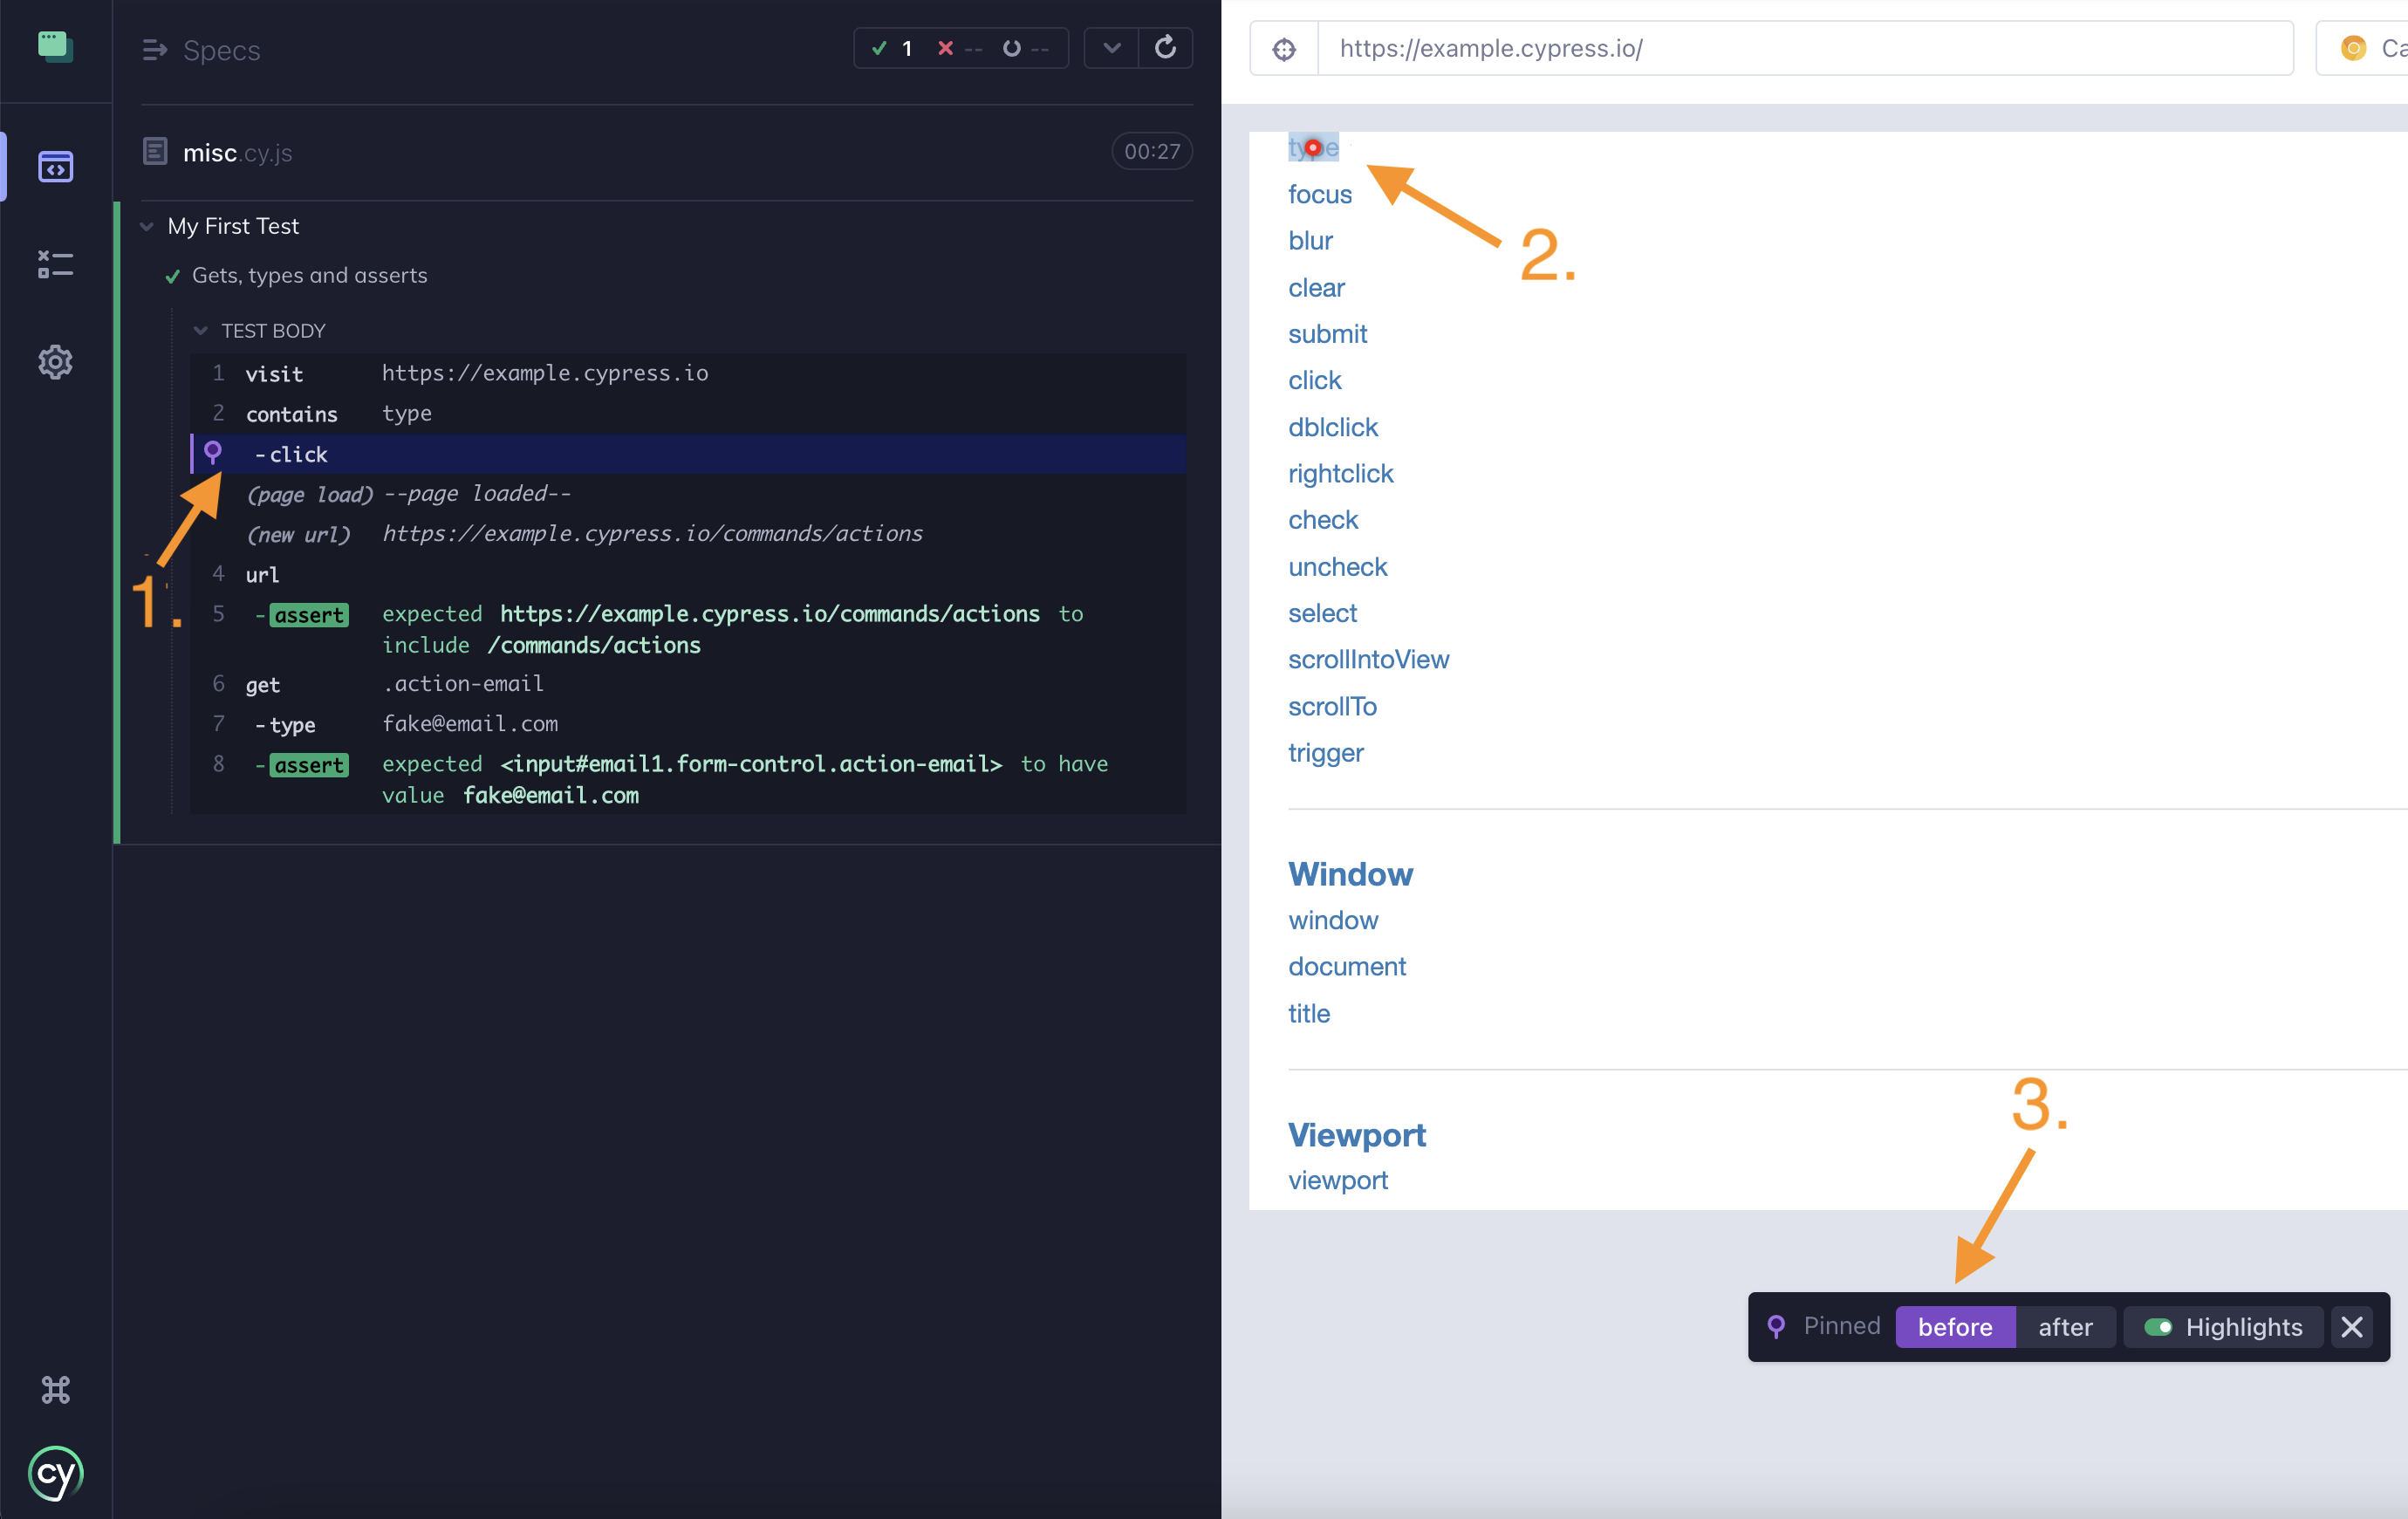
1. Pinned snapshots
We have now pinned this snapshot. Hovering over other commands will not revert to them. This gives us a chance to manually inspect the DOM of our application under test at the time the snapshot was taken.
2. Event hitbox
Since .click() is an action command, that means we also
see a red hitbox at the coordinates the event took place.
3. Snapshot menu panel
There is also a new menu panel. Some commands (like action commands) will take multiple snapshots: before and after. We can now cycle through these.
The before snapshot is taken prior to the click event firing. The after snapshot is taken immediately after the click event. Although this click event caused our browser to load a new page, it's not an instantaneous transition. Depending on how fast your page loaded, you may still see the same page, or a blank screen as the page is unloading and in transition.
When a command causes an immediate visual change in our application, cycling
between before and after will update our snapshot. We can see this in action by
clicking the TYPE command in the Command Log. Now, clicking before will
show us the input in a default state, showing the placeholder text. Click
after will show us what the input looks like when the TYPE command has
completed.
Page events
In addition to showing all the commands that were called, the command log also shows important events from your application or component when they occur. Notice these look different (they are gray and without a number).

Cypress logs out page events for:
- Network XHR Requests
- URL hash changes
- Page Loads
- Form Submissions
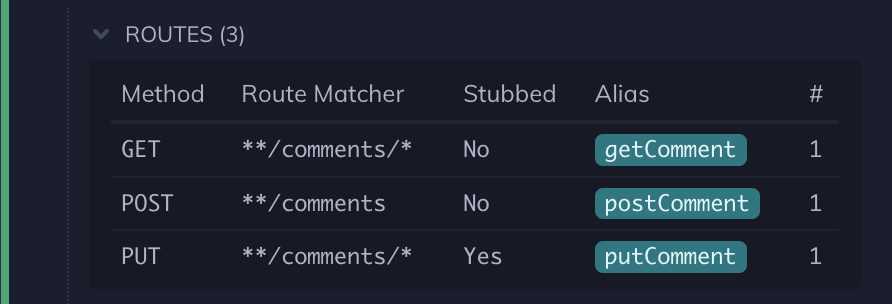
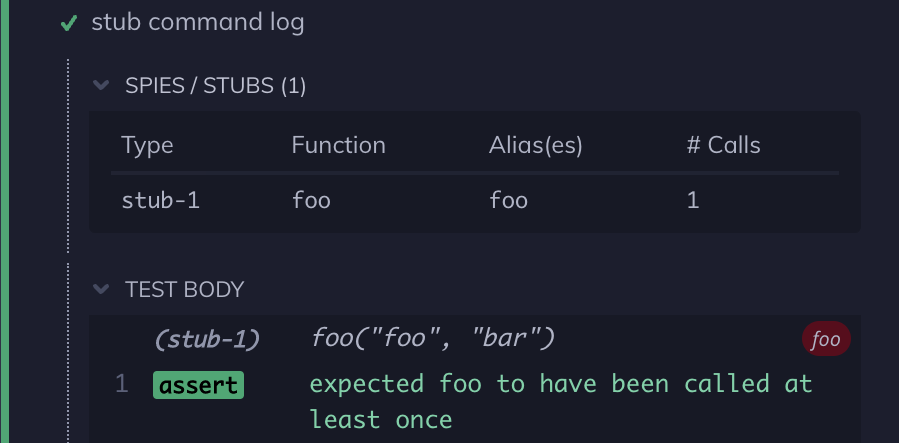
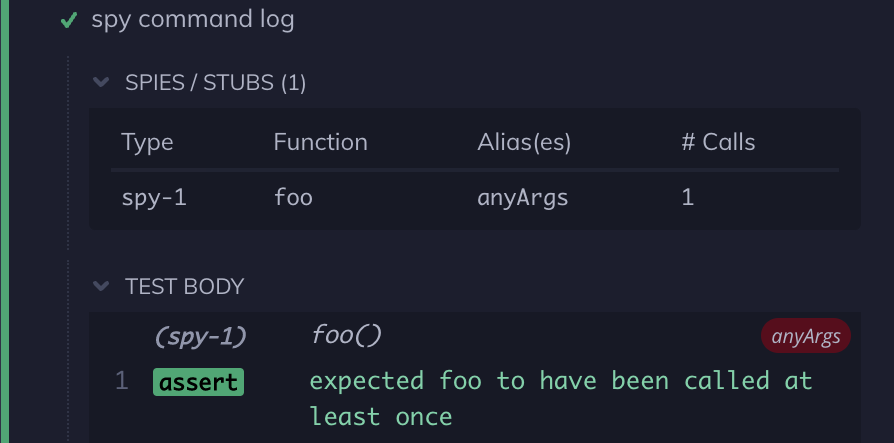
Instrument panel
For certain commands like cy.intercept(),
cy.stub(), and cy.spy(), an extra
instrument panel is displayed above the test to give more information about the
state of your tests.
Routes
Stubs
Spies
Preview pane
The right-hand side of the Test Runner is where the Application or Component Under Test is rendered.
Application Under Test End-to-End Only
In
E2E Testing,
the right-hand side of the Test Runner is used to display the Application Under
Test (AUT): the application that was navigated to using a
cy.visit() or any subsequent routing calls made from
the visited application.
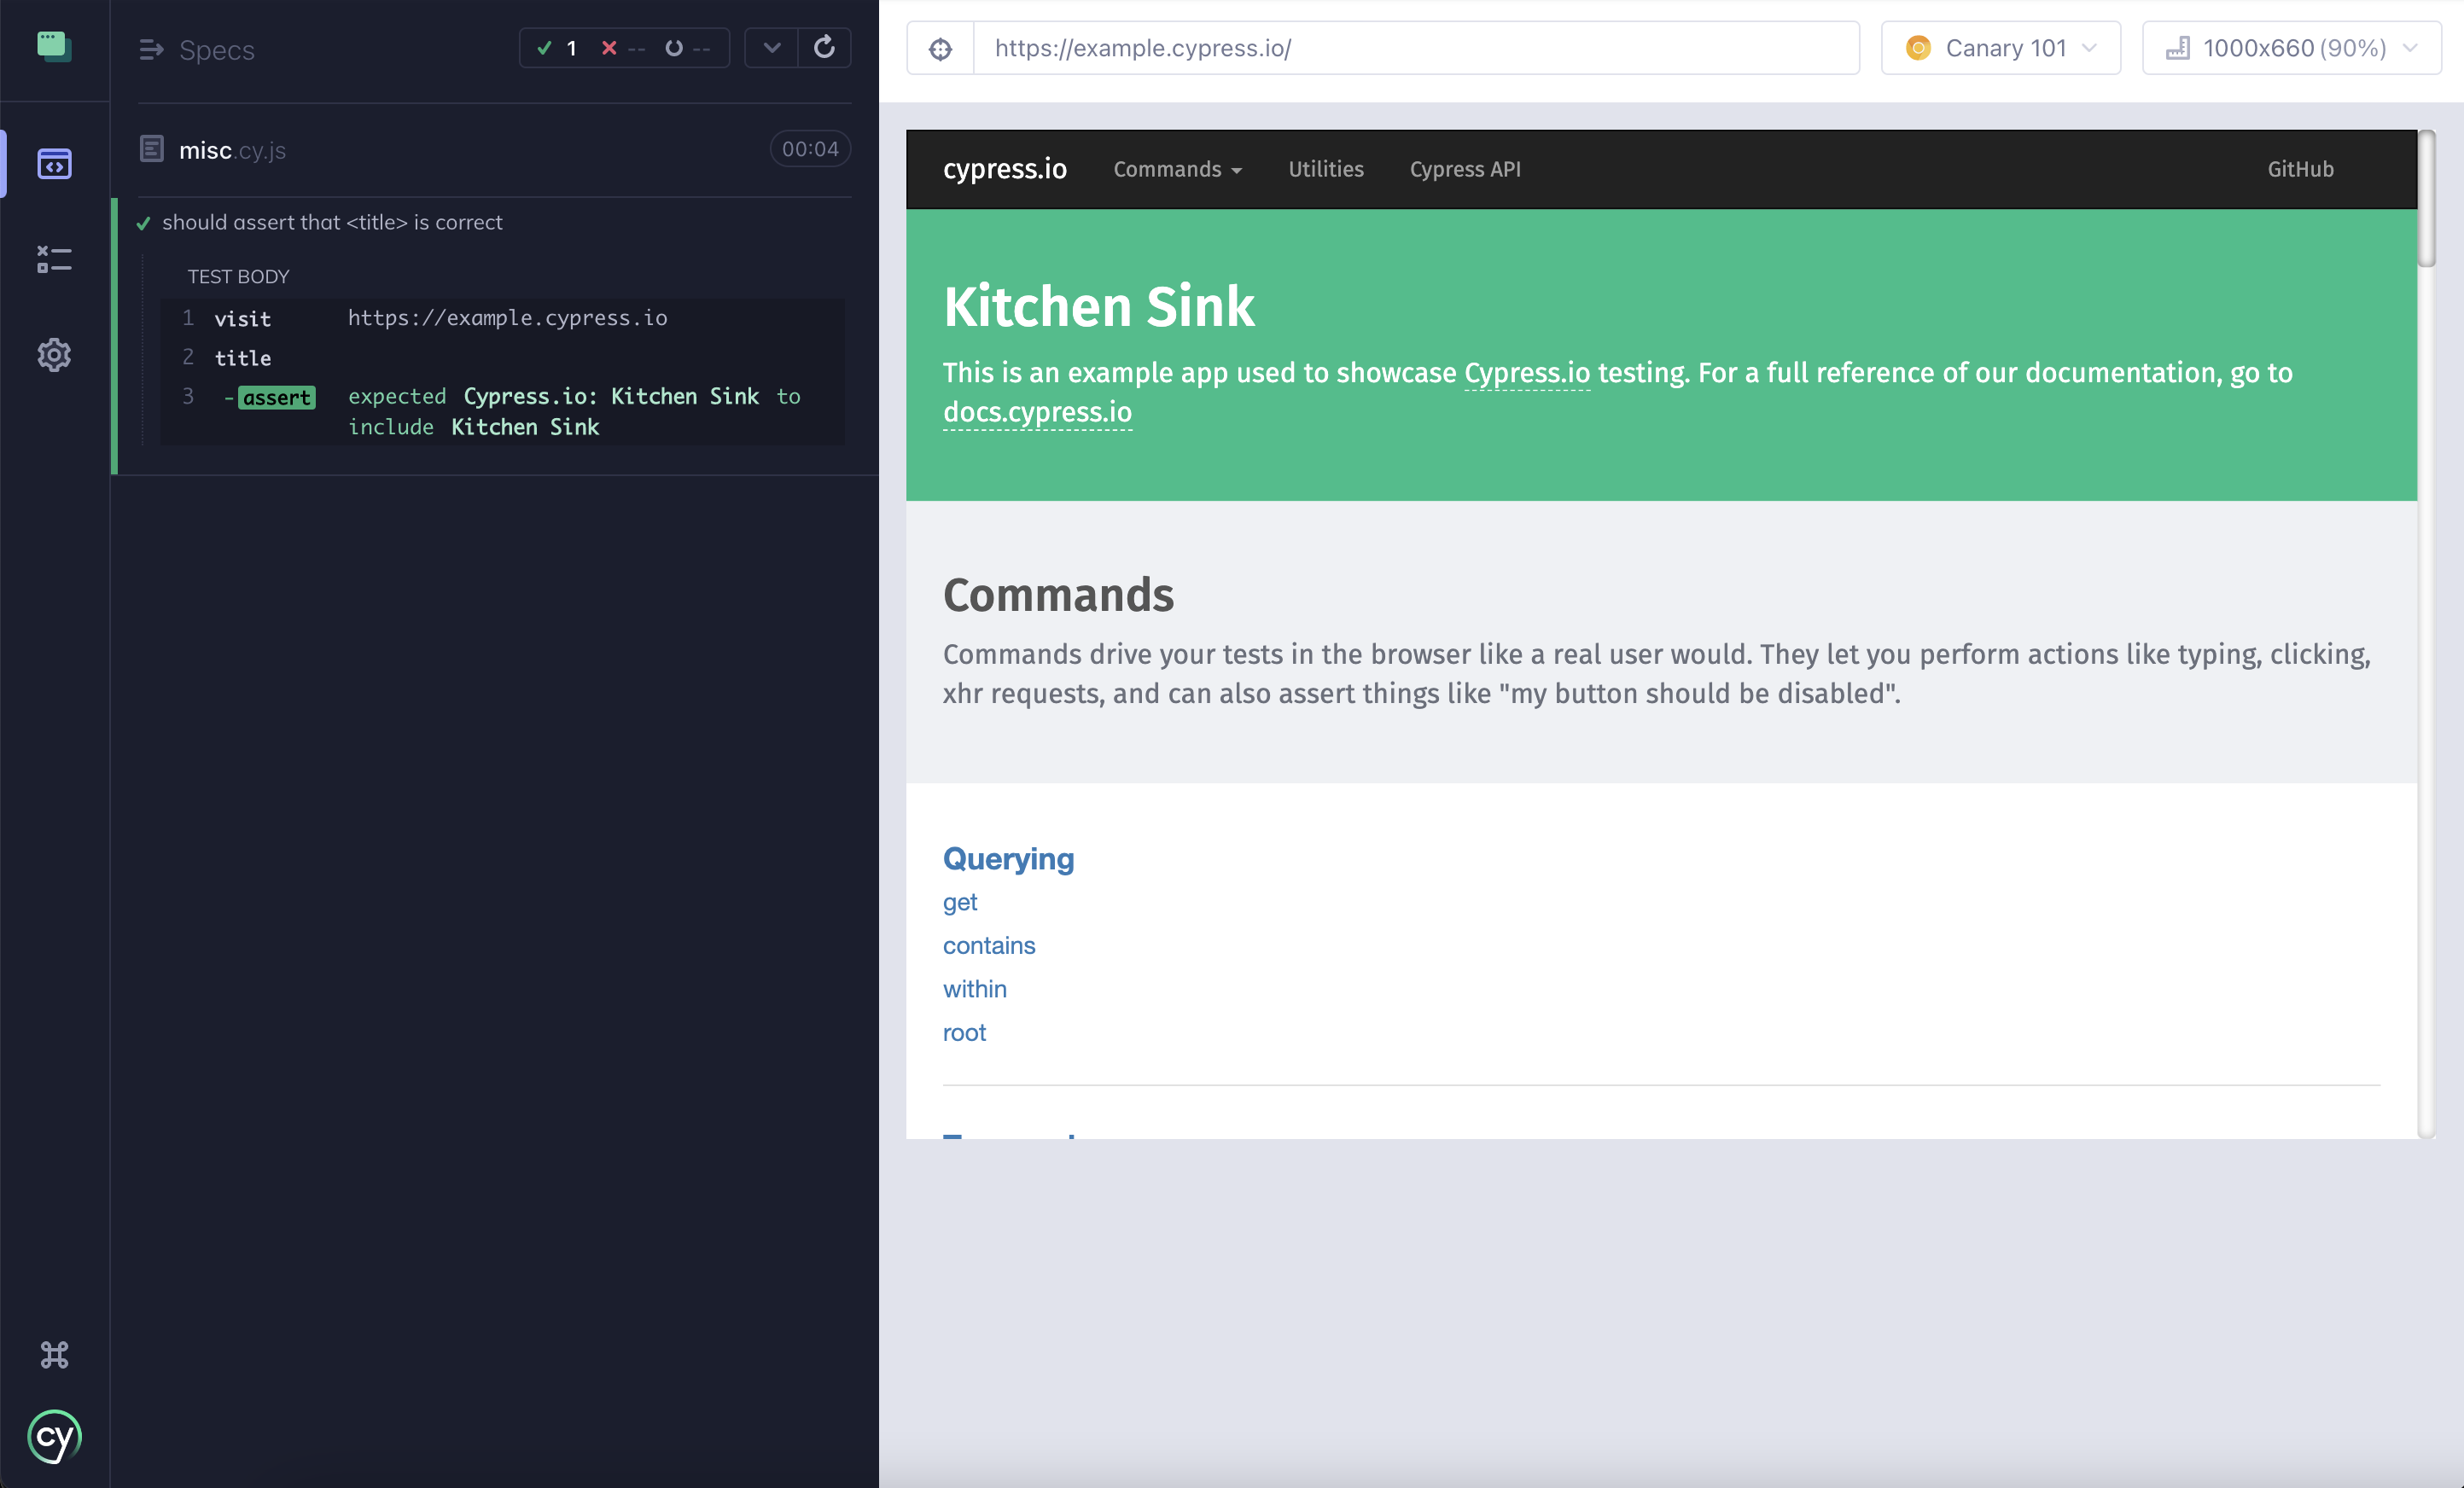
In the example below, we wrote the following code in our test file:
cy.visit('https://example.cypress.io')

cy.title().should('include', 'Kitchen Sink')
In the corresponding application preview below, you can see
https://example.cypress.io is being displayed in the right-hand side. Not only
is the application visible, but it is fully interactive. You can open your
developer tools to inspect elements as you would in your normal application. The
DOM is completely available for debugging.
The AUT also displays in the size and orientation specified in your tests. You
can change the size or orientation with the
cy.viewport() command or in your
Cypress configuration. If the AUT
does not fit within the current browser window, it is scaled appropriately to
fit within the window.
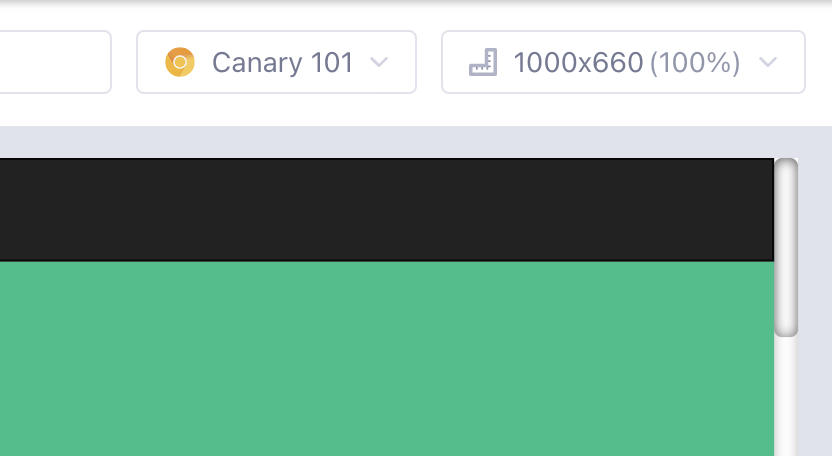
The current size and scale of the AUT is displayed in the top right corner of the window.
The image below shows that our application is displaying at 1000px width,
660px height and scaled to 100%.
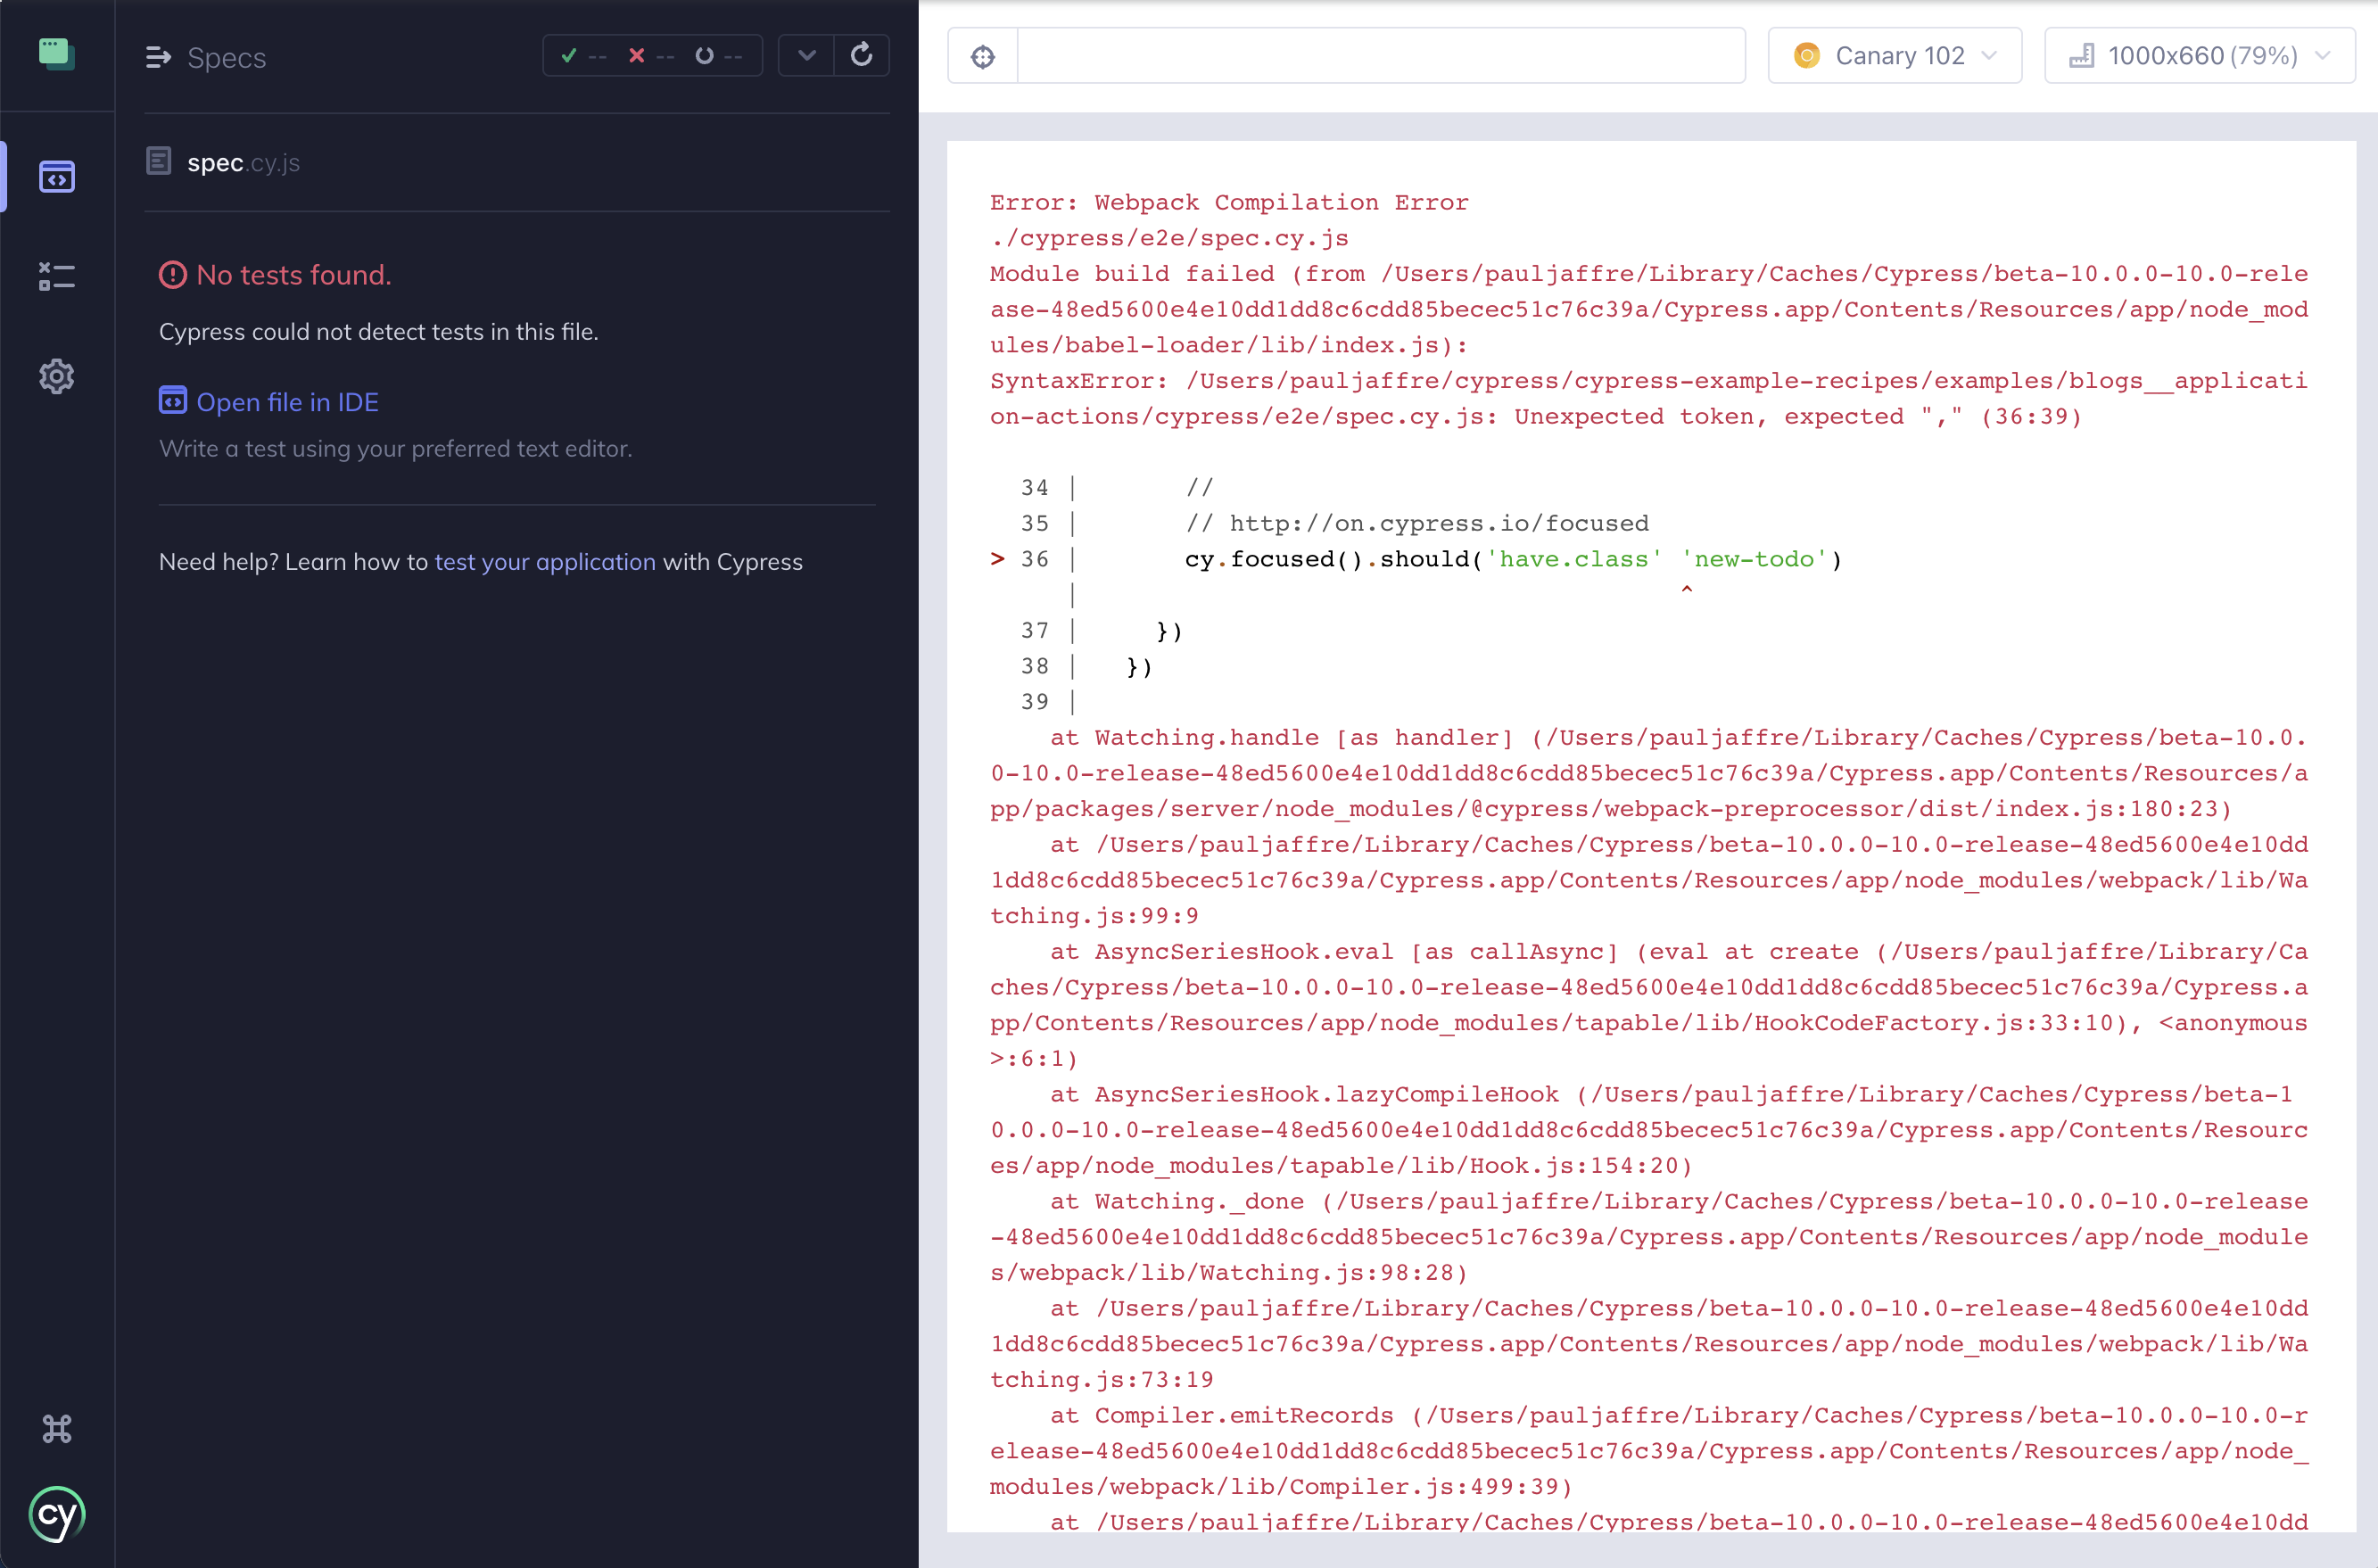
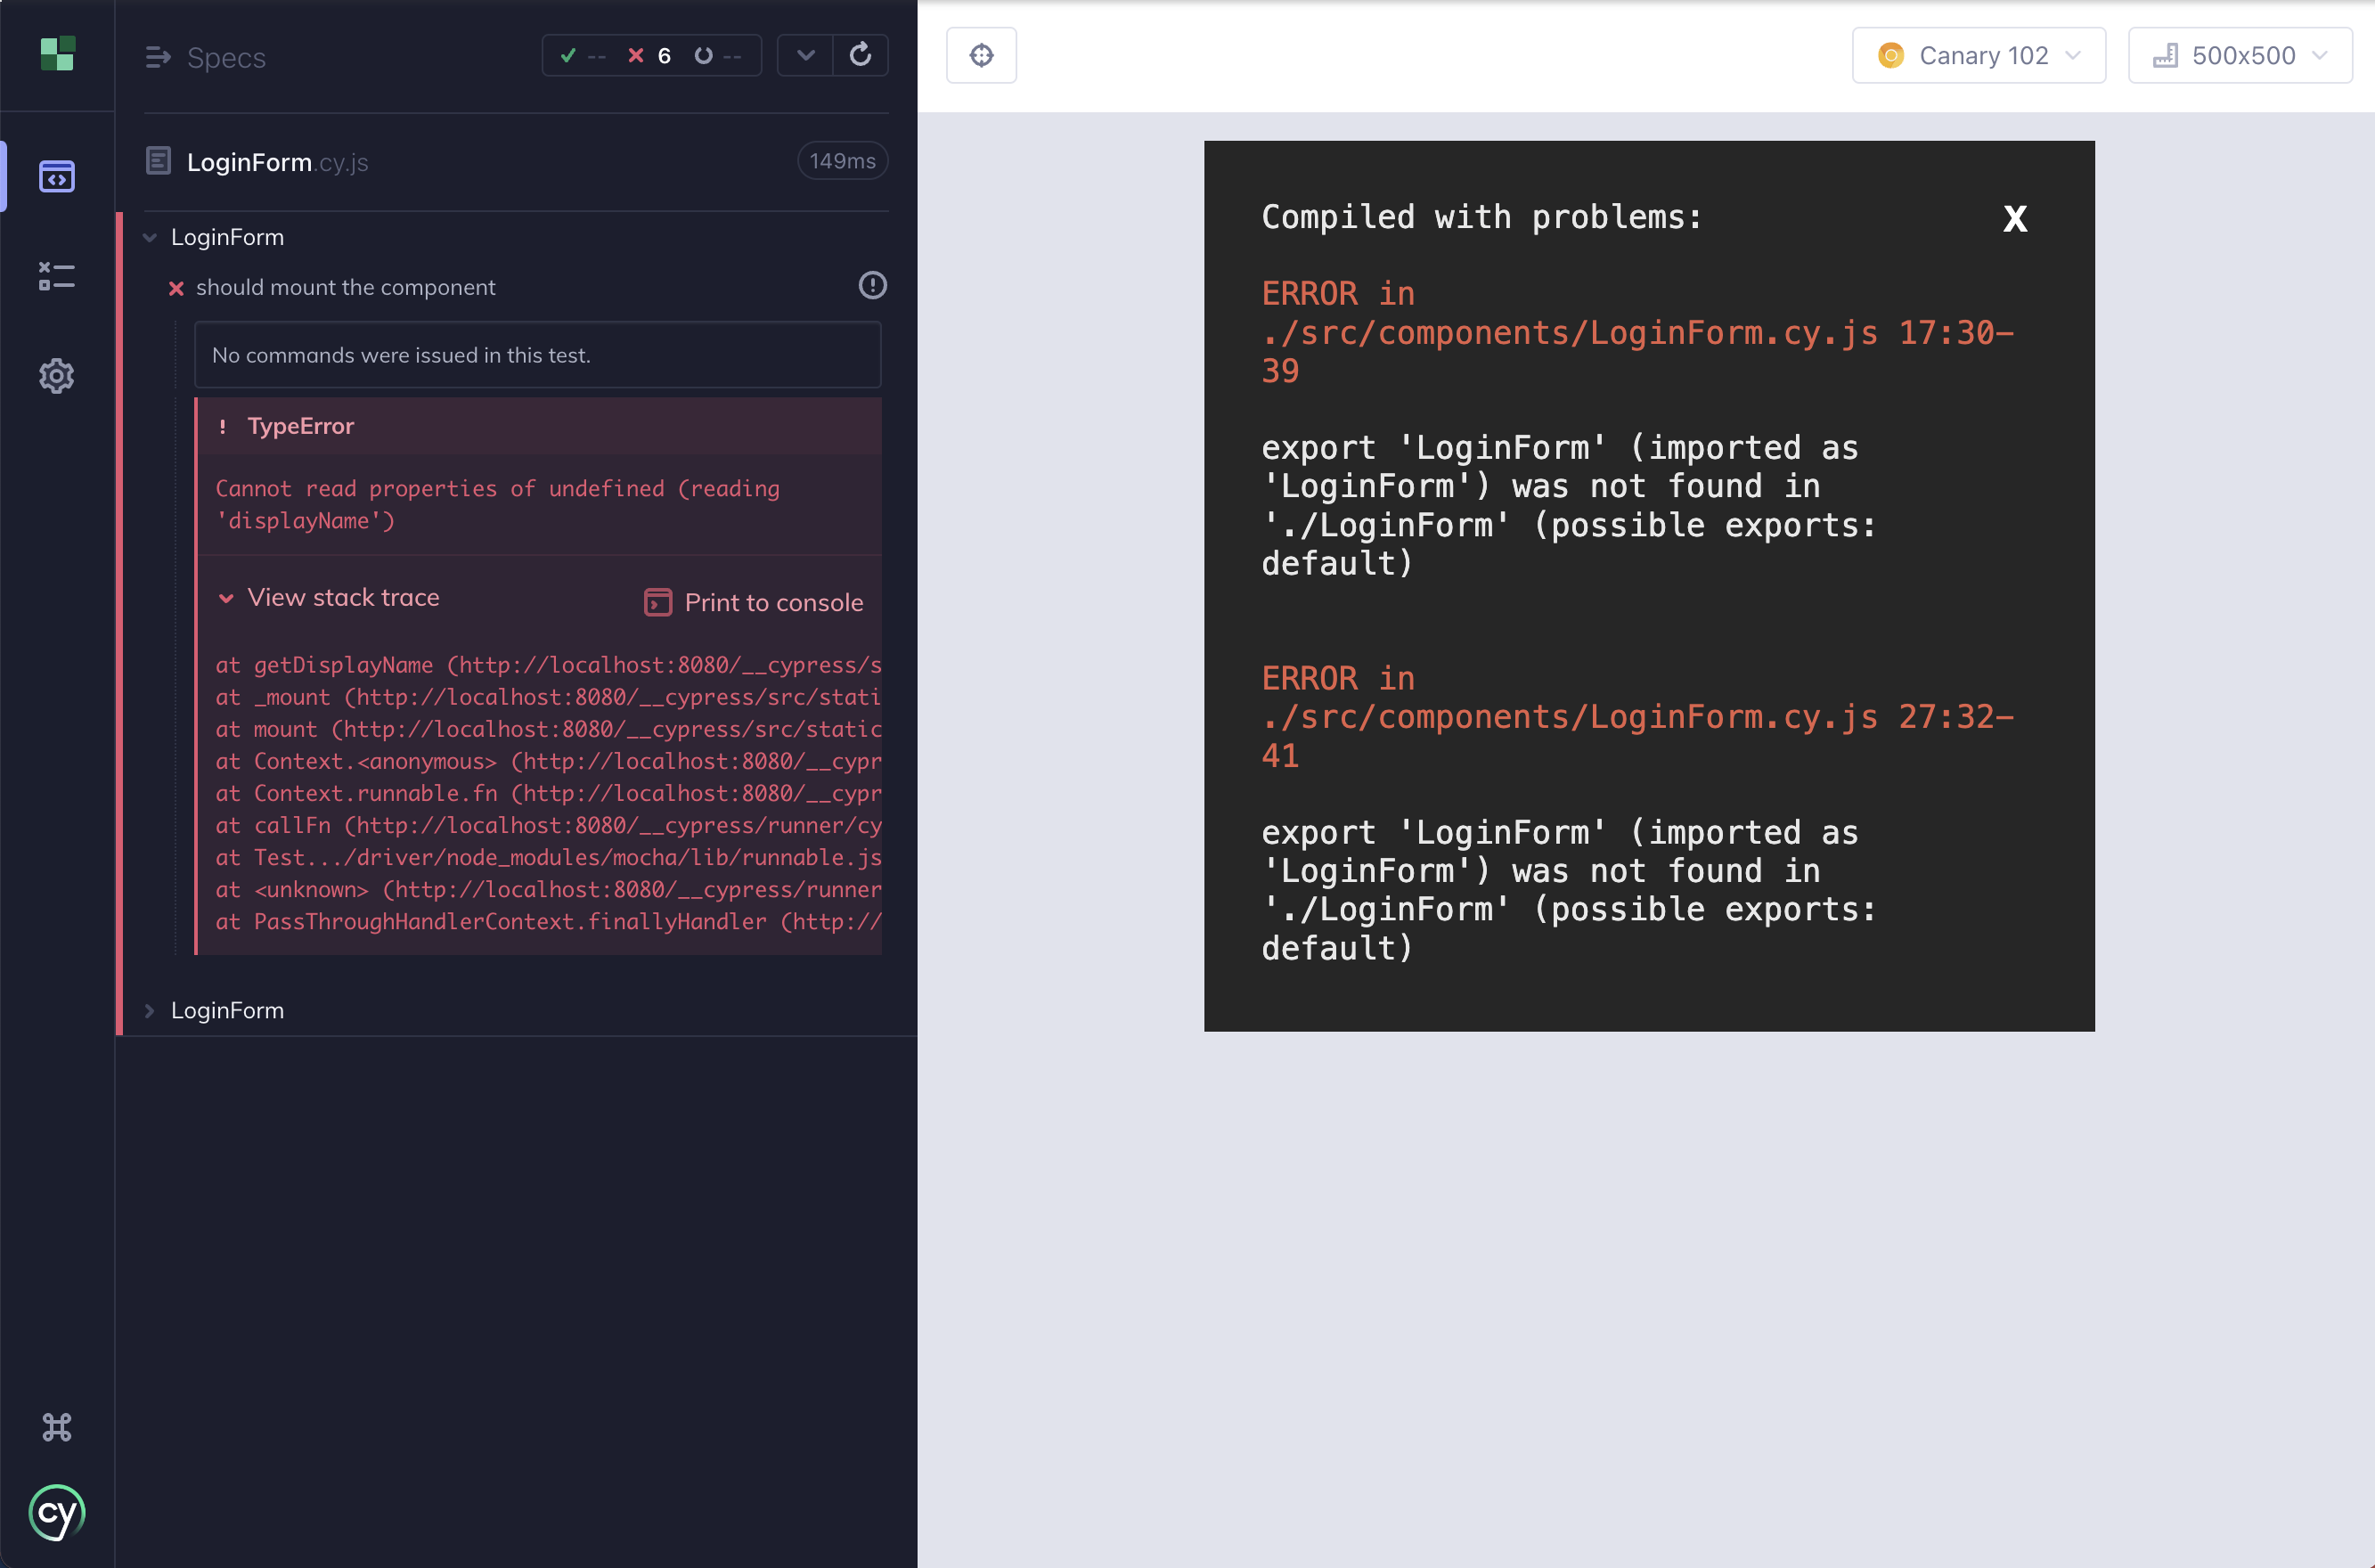
The right-hand side may also be used to display syntax errors in your spec file that prevent the tests from running.
Internally, the AUT renders within an iframe. This can sometimes cause unexpected behaviors explained here.
Component Under Test Component Only
In
Component testing,
the right-hand side of the Test Runner is used to display the Component Under
Test (CUT): the component that was mounted using the
cy.mount() command.
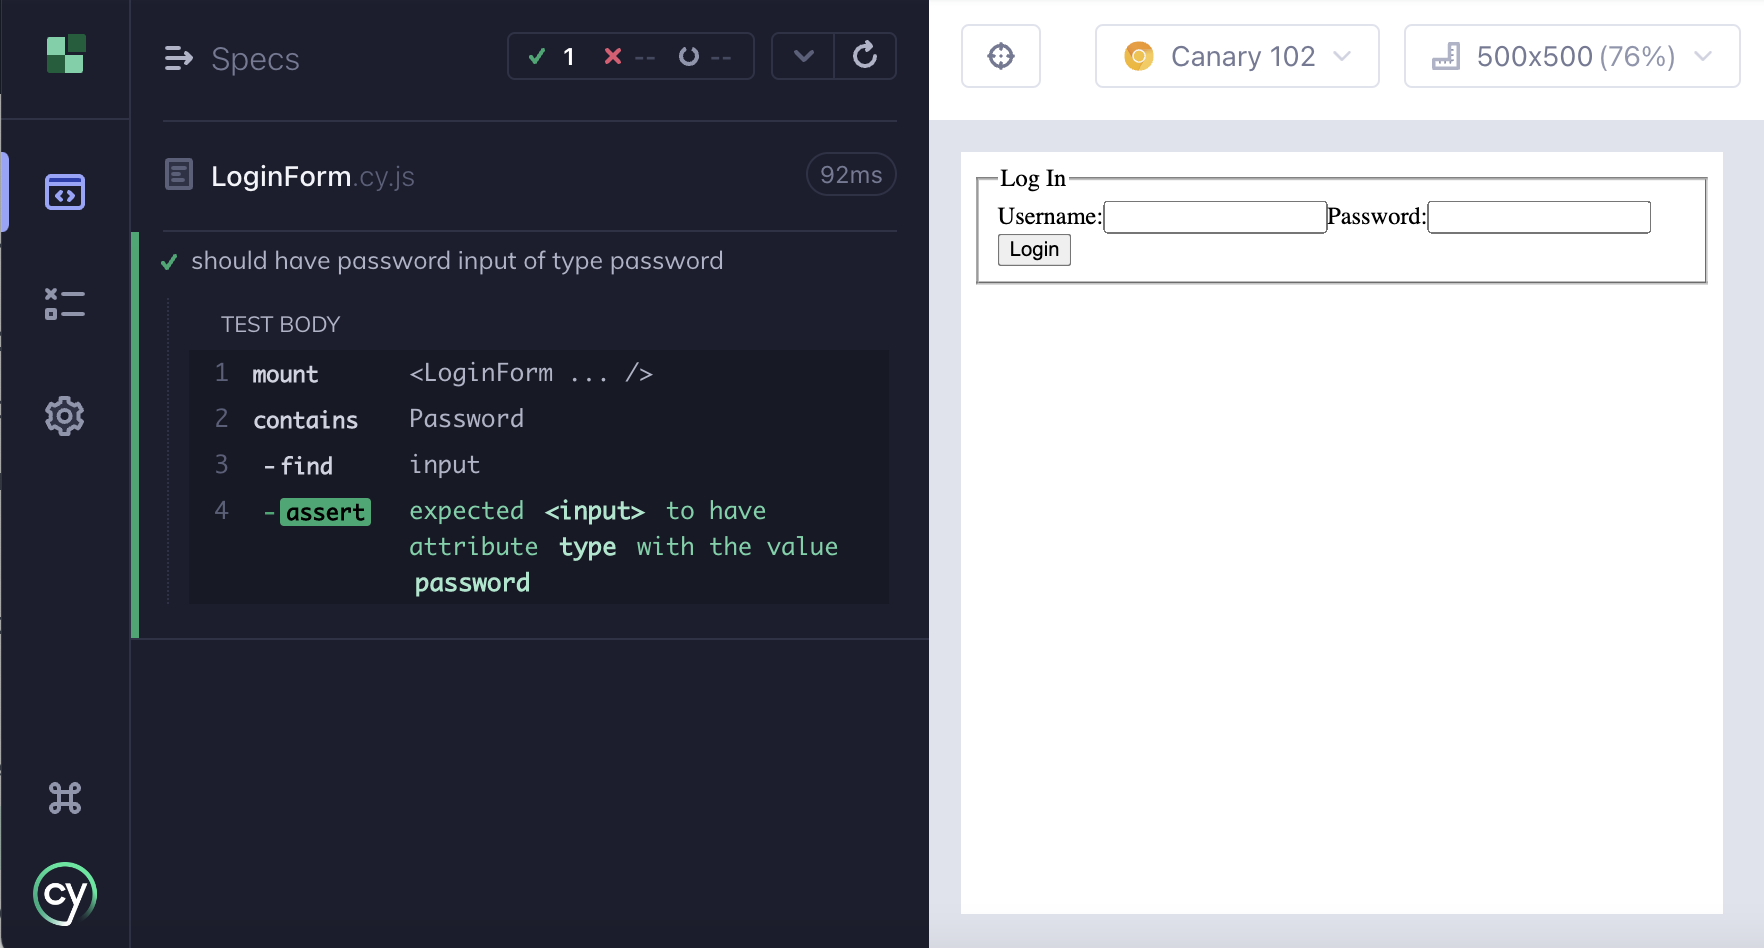
In the following example, we have the following test in our spec file:
- React
- Vue
it('should have password input of type password', () => {
  mount(<LoginForm />)
  cy.contains('Password').find('input').should('have.attr', 'type', 'password')
})
it('should have password input of type password', () => {
  mount(LoginForm)
  cy.contains('Password').find('input').should('have.attr', 'type', 'password')
})
In the corresponding Component Preview below, you can see the LoginForm
component is being displayed in the right-hand side. Not only is the component
visible, but it is fully interactable. You can open your developer tools to
inspect elements as you would in your normal application. The DOM is completely
available for debugging.
The CUT also displays in the size and orientation specified in your tests. You
can change the size or orientation with the
cy.viewport() command or in your
Cypress configuration. If the CUT
does not fit within the current browser window, it is scaled appropriately to
fit within the window.
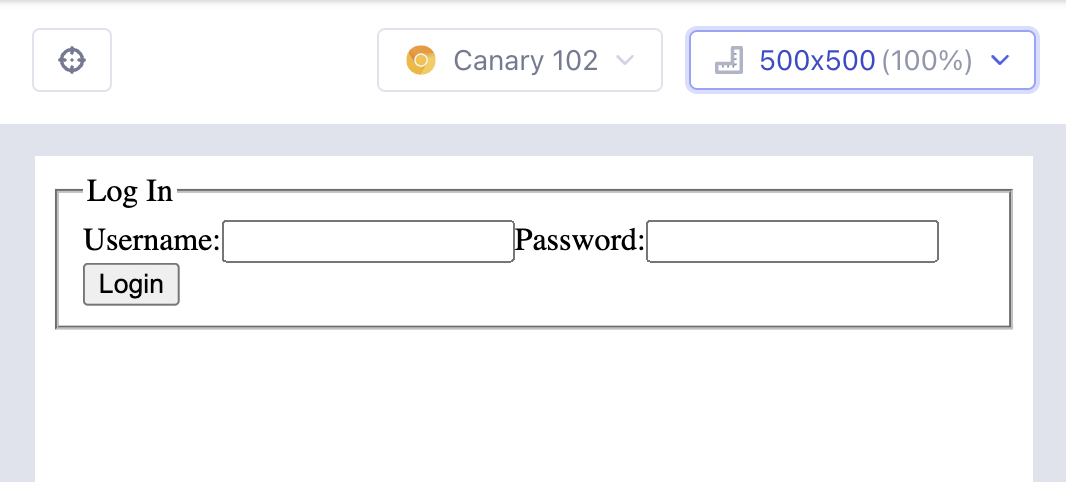
The current size and scale of the CUT is displayed in the top right corner of the window.
The image below shows that our application is displaying at 500px width,
500px height and scaled to 100%.
The right-hand side may also be used to display syntax errors in your spec file that prevent the tests from running.
Internally, the AUT renders within an iframe. This can sometimes cause unexpected behaviors explained here.
Selector Playground
The Selector Playground is an interactive feature that helps you:
- Determine a unique selector for an element.
- See what elements match a given selector.
- See what element matches a string of text.
Needing a low code approach to create tests? Use Cypress Studio to record your browser interactions.
Uniqueness
Cypress will automatically calculate a unique selector to use targeted element by running through a series of selector strategies.
Default Selector Priority
data-cydata-testdata-testiddata-qaidclasstagattributesnth-child
Cypress allows you to control how a selector is determined.
Use the Cypress.SelectorPlayground API to control the selectors you want returned.
Best practices
You may find yourself struggling to write good selectors because:
- Your application or component uses dynamic ID's and class names
- Your tests break whenever there are CSS or content changes
To help with these common challenges, the Selector Playground automatically
prefers certain data-* attributes when determining a unique selector.
Please read our Best Practices guide on helping you target elements and prevent tests from breaking on CSS or JS changes.
Finding selectors
To open the Selector Playground, click the button next to the URL at the top of the Test Runner. Hover over elements in your app to preview a unique selector for that element in the tooltip.
Click on the element and its selector will appear at the top. From there, you can copy it to your clipboard ( ) or print it to the console ( ).
Running experiments
The box at the top that displays the selector is also a text input.
Editing a selector
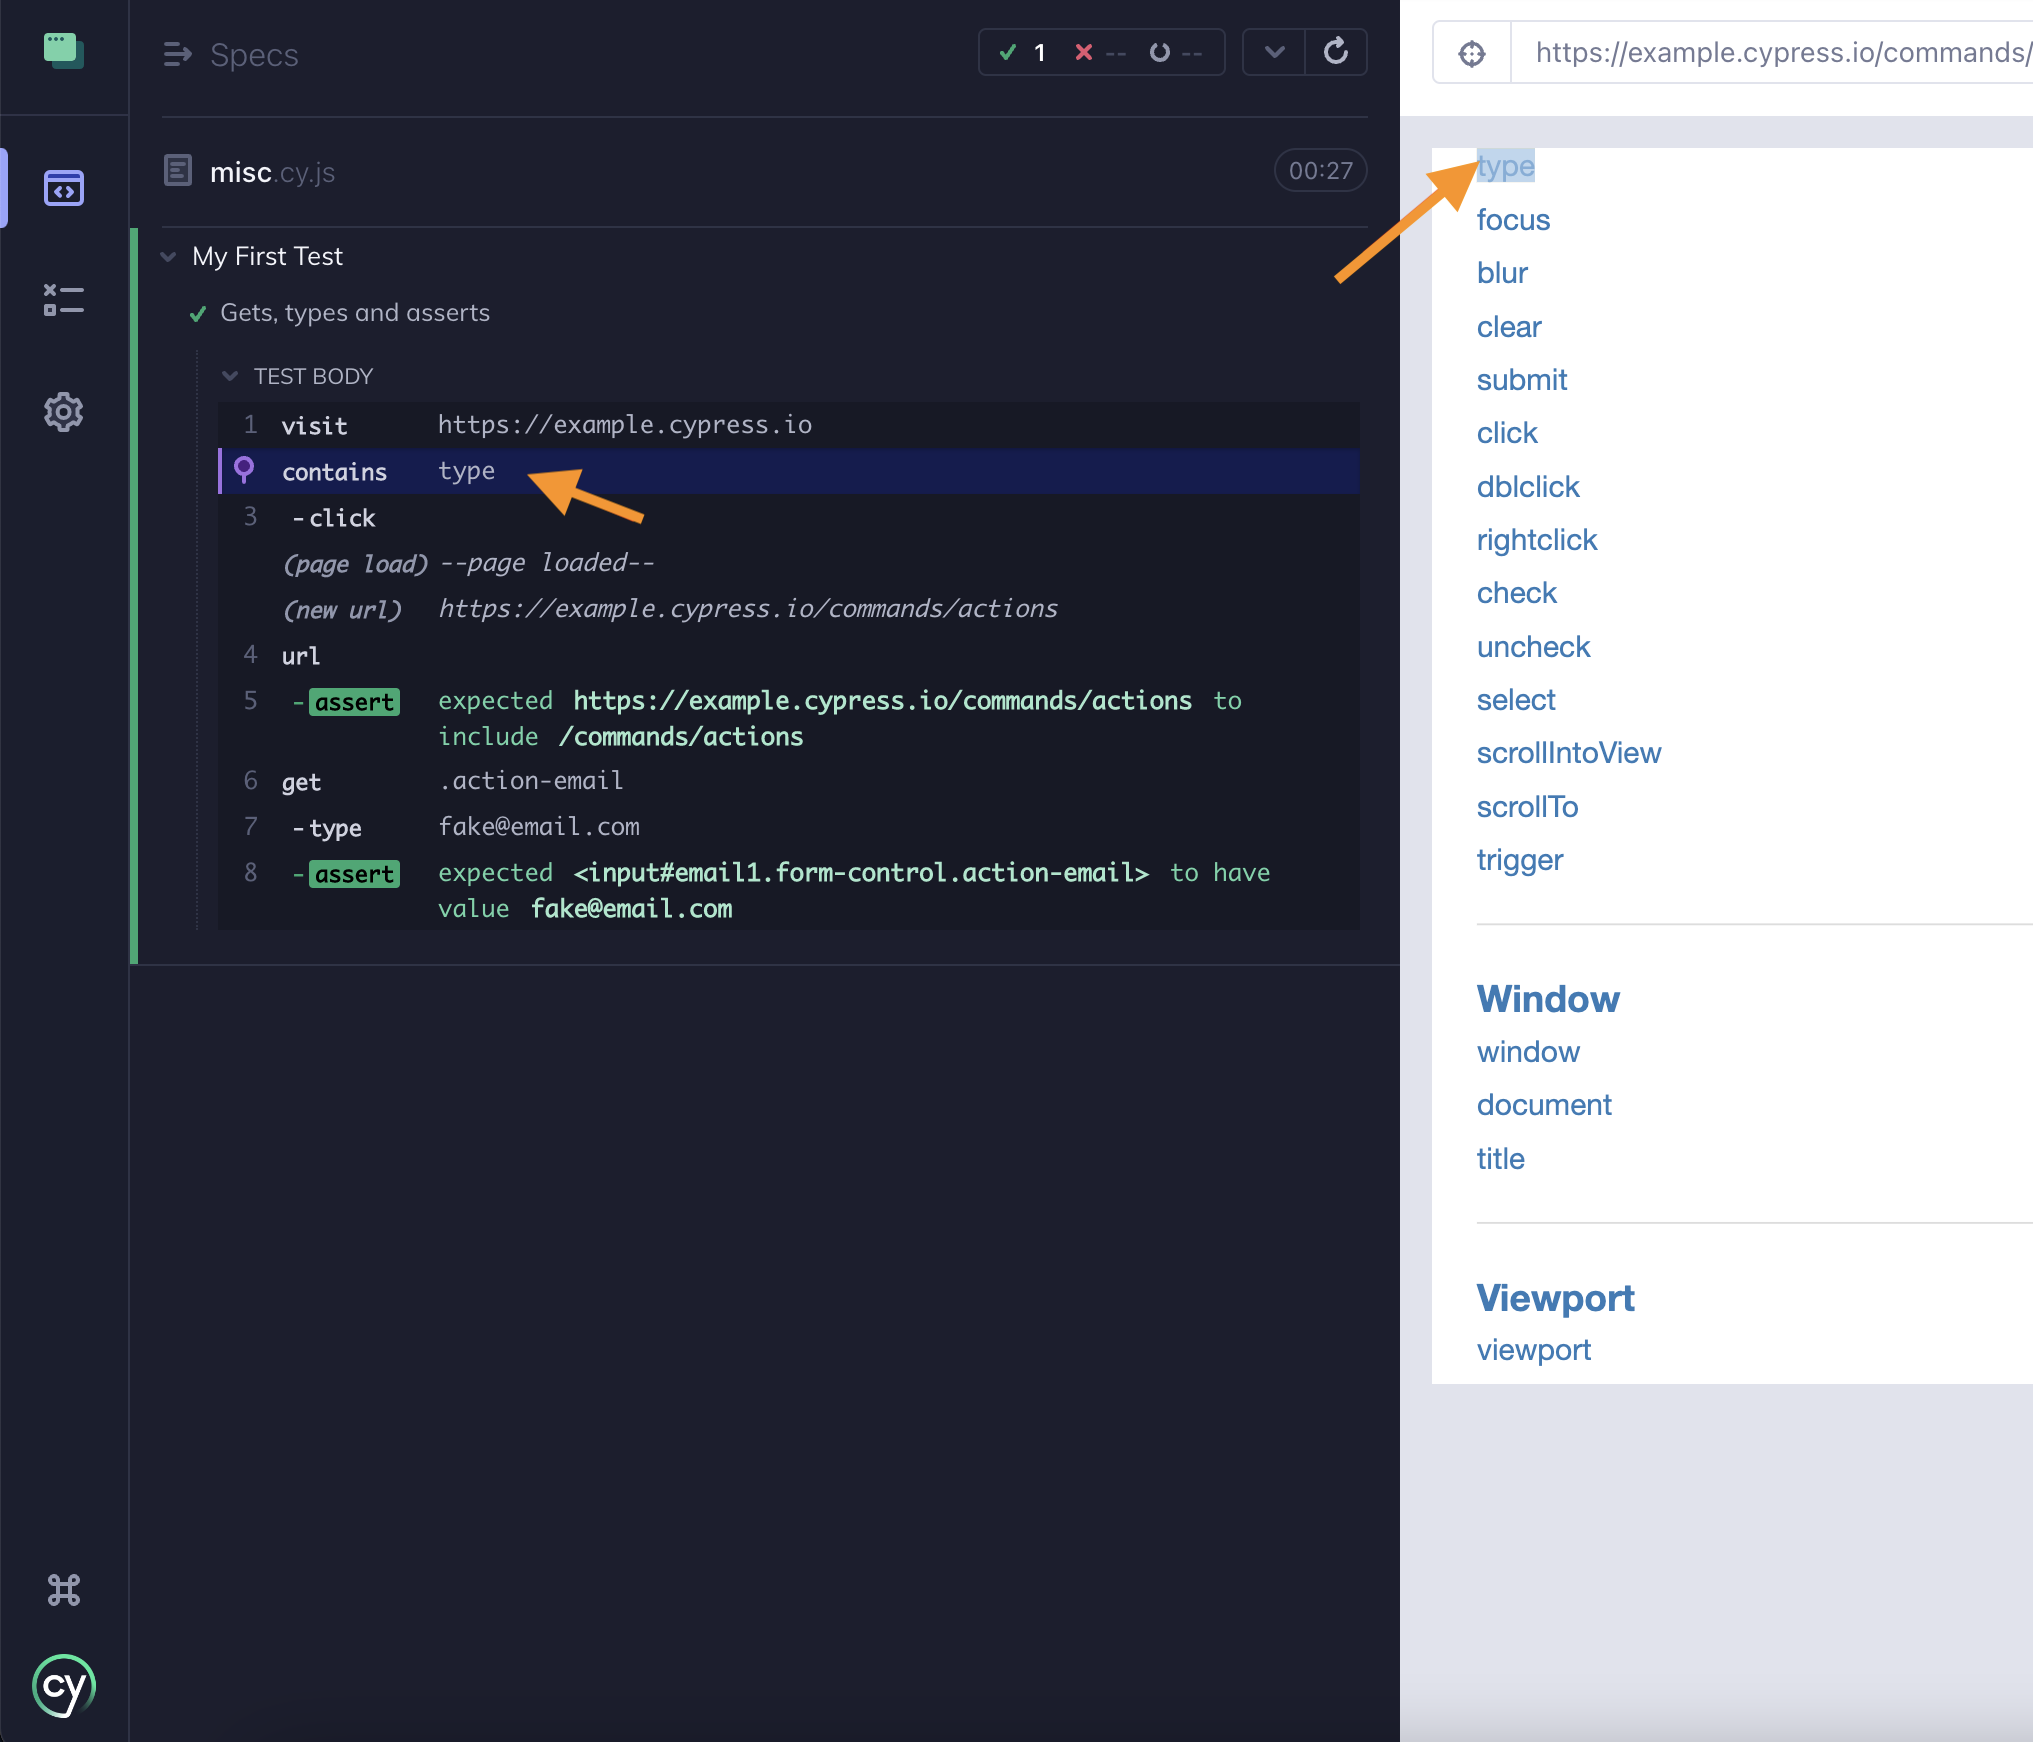
When you edit the selector, it will show you how many elements match and highlight those elements in your app.

Switching to contains
You can also experiment with what cy.contains()
would yield given a string of text. Click on cy.get and switch to
cy.contains.
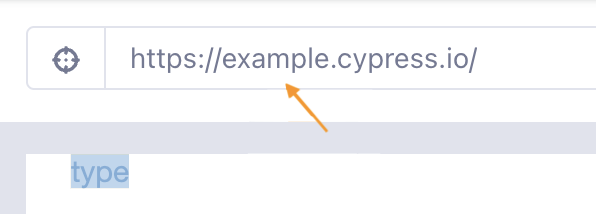
Type in text to see which element it matches. Note that
cy.contains() only yields the first element that
matches the text, even if multiple elements on the page contain the text.

Disabling highlights
If you would like to interact with your app while the Selector Playground is open, the element highlighting might get in the way. Toggling the highlighting off will allow you to interact with your app more easily.
Keyboard shortcuts
There are keyboard shortcuts to quickly perform common actions from within Cypress.
| Key | Action |
|---|---|
r | Rerun tests |
s | Stop tests |
f | Bring focus to 'specs' window |
Debugging
In addition to the features already mentioned, Cypress comes with a host of debugging tools to help you understand a test. You can:
- See detailed information about errors that occur.
- Receive additional console output about each command.
- Pause commands and step through them iteratively.
Errors
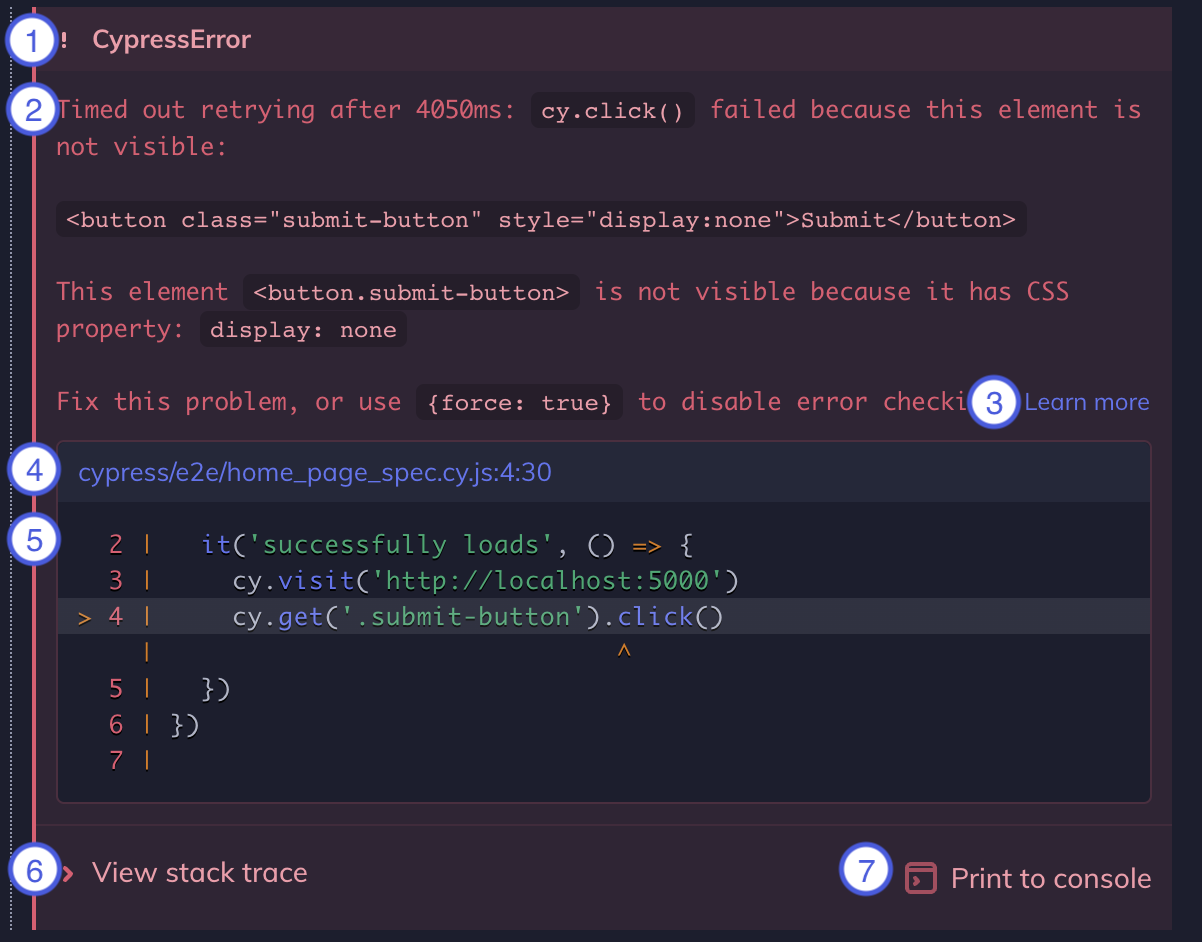
Cypress prints several pieces of information when an error occurs during a Cypress test.
- Error name: This is the type of error (e.g.
AssertionError,CypressError) - Error message: This generally tells you what went wrong. It can vary in length. Some are short like in the example, while some are long, and may tell you exactly how to fix the error.
- Learn more: Some error messages contain a Learn more link that will take you to relevant Cypress documentation.
- Code frame file: This is usually the top line of the stack trace and it shows the file, line number, and column number that is highlighted in the code frame below. Clicking on this link will open the file in your preferred file opener and highlight the line and column in editors that support it.
- Code frame: This shows a snippet of code where the failure occurred, with the relevant line and column highlighted.
- View stack trace: Clicking this toggles the visibility of the stack trace. Stack traces vary in length. Clicking on a blue file path will open the file in your preferred file opener.
- Print to console button: Click this to print the full error to your DevTools console. This will usually allow you to click on lines in the stack trace and open files in your DevTools.
Console output
Besides commands being interactive, they also output additional debugging information to your console.
Open up your Dev Tools and click on the GET for the .action-email class
selector.
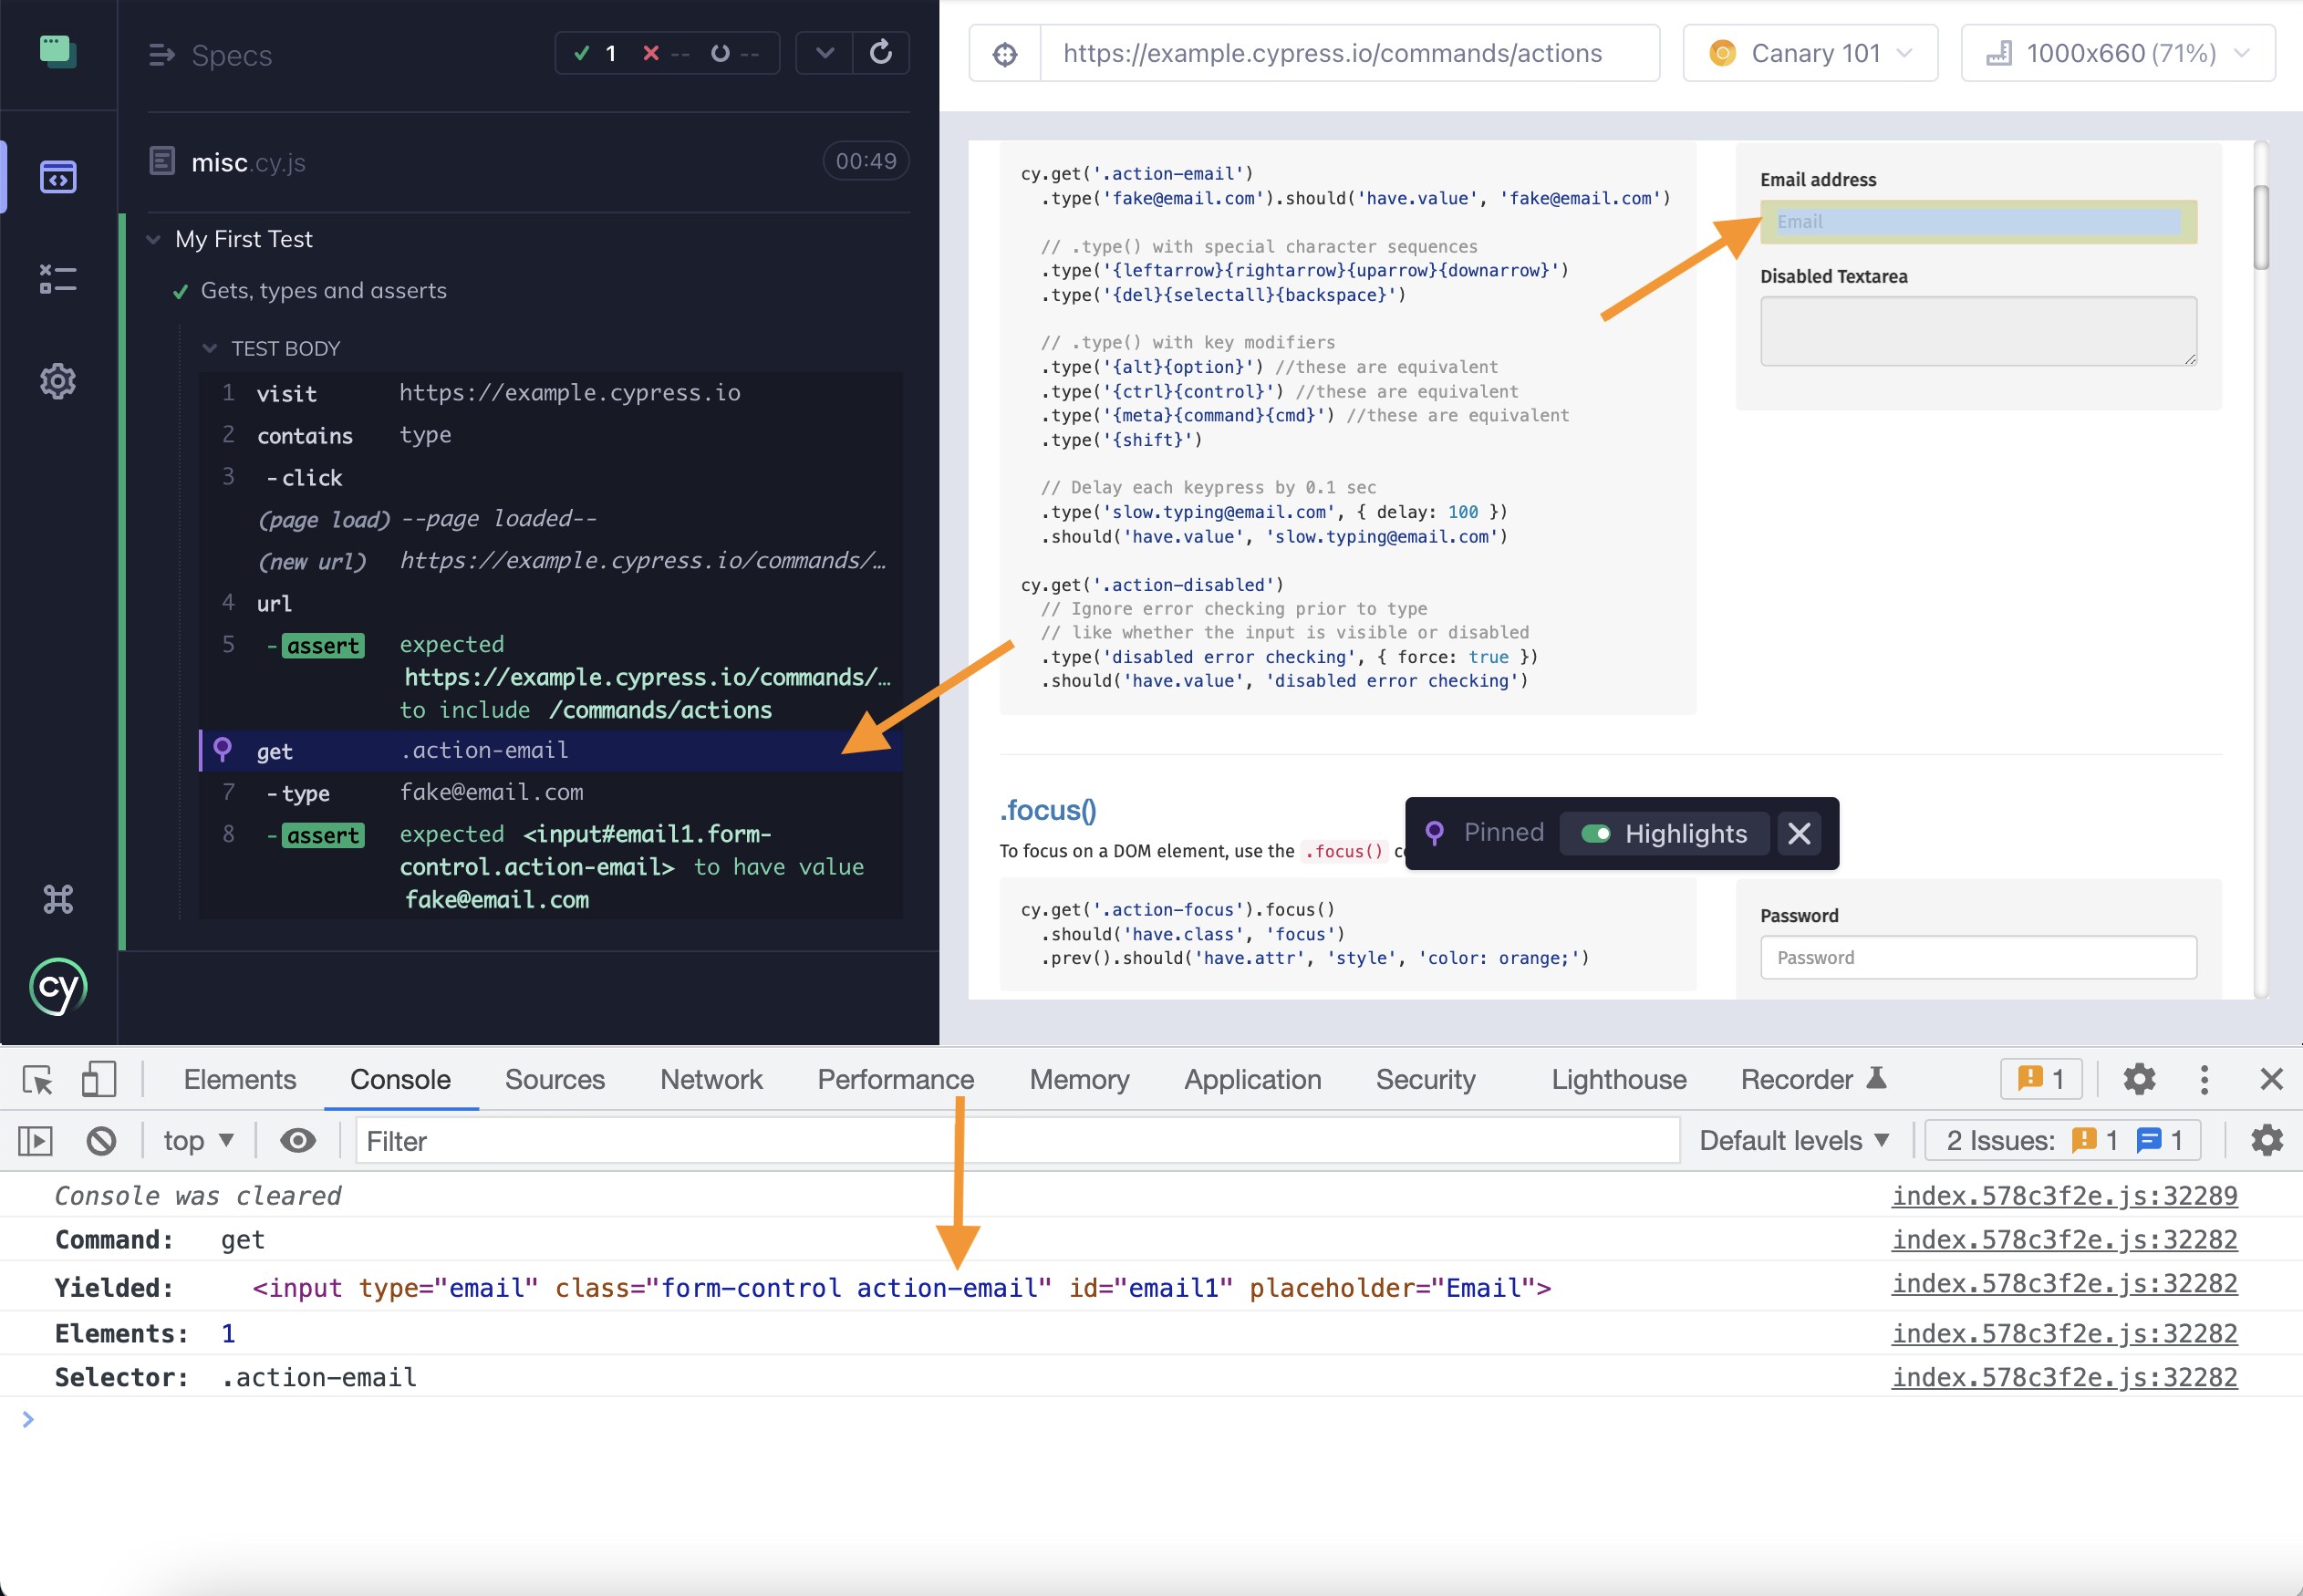
We can see Cypress output additional information in the console:
- Command (that was issued)
- Yielded (what was returned by this command)
- Elements (the number of elements found)
- Selector (the argument we used)
We can even expand what was returned and inspect each individual element or even right click and inspect them in the Elements panel!
Special commands
In addition to having a helpful UI, there are also special commands dedicated to the task of debugging, for example:
In the following example, we've added a cy.pause() command to this test:
describe('My First Test', () => {
  it('clicking "type" shows the right headings', () => {
    cy.visit('https://example.cypress.io')

    cy.pause()

    cy.contains('type').click()

    // Should be on a new URL which includes '/commands/actions'
    cy.url().should('include', '/commands/actions')

    // Get an input, type into it and verify that the value has been updated
    cy.get('[data-testid="action-email"]')
      .type('[email protected]')
      .should('have.value', '[email protected]')
  })
})
Now, when the test runs, Cypress provides us a UI (similar to debugger) to step forward through each command in the test.
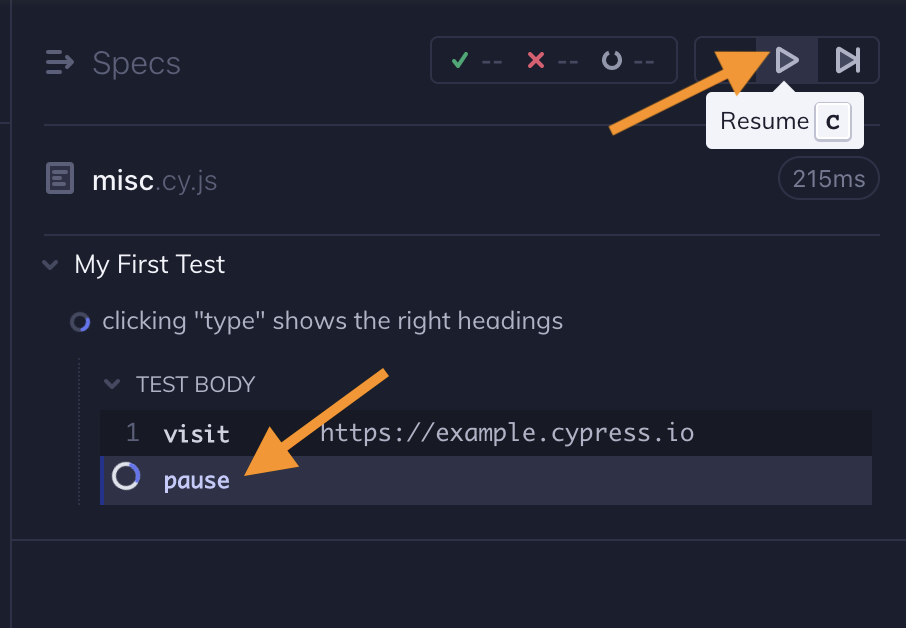
In action:
History
| Version | Changes |
|---|---|
| 3.5.0 | Added keyboard shortcuts to Cypress |
| 1.3.0 | Added Selector Playground |